We love data. Yet we often only know enough to use the data, without knowing the story behind it. But, while in Kenya to work on the Schools Mapping Project, I finally learned the story of a key data set to our project.
The creation story of a data set is essential for understanding the peculiarities of that data, and how data collection in the future can be improved (and there always will be a future data collection). Among the most popular and useful data sets released on OpenData Kenya are the locations and indicators of primary and secondary schools, Kenya wide. Over 70,000 schools which also double as polling places in elections. So, a super important and impressive data set.
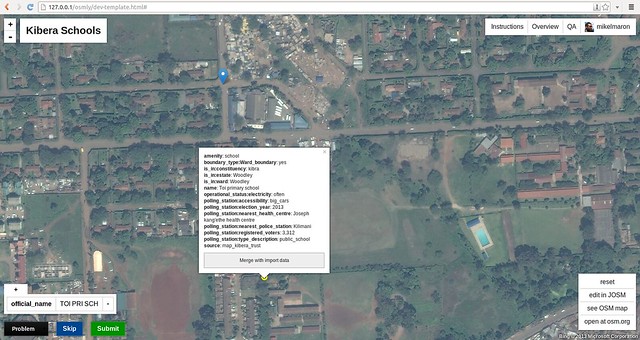
And I have had a lot of questions about it. One of the key parts of our project is to make authoritative data and community data inter-operable. In the process of matching OpenStreetMap schools to Kenya Open Data (KOD) schools, I found something puzzling. The locations in KOD of schools in the Kibera slum were off by hundreds of meters from the OSM data, and not in a consistent way that would suggest a projection issue or such. We have reason to trust the OSM data, as it was collected directly by GPS and confirmed with the community (and, it’s one of the powers of OpenStreetMap that our data story is completely out in the open). Other studies of the KOD data set had also found issues; like research from the World Bank (Points of Knowledge – Crowdsourcing Solutions to Improve Data Accuracy and Re-use in Kenya), which found a majority of primary schools were mis-located. Yet, this was a stupendous data set to put together, a real challenge, over 70,000 schools, back in 2007. How did they do it, and what can we learn?
Last month, I found myself sitting across from Teddy Ochieng at the Gigiri Java House. Through colleagues at USAID Geocenter, I connected with Teddy, currently a GIS officer at USAID. Teddy was generous with his insights on the state of school GIS data. And he just happened to have been a part of the team that collected the 2007 schools data. A man behind the curtain moment!
The Ministry of Education provided a list of over 70000 schools. They started with 15 teams, ending with 10. Each team had 3 people: a lead data collector, an assistant, and a driver. Most all of the data was collected in 2007, but some areas affected by the 2007-8 post-election were hard to reach, and waited until into 2008. They used ArcGIS and Excel to manage data. GPS used were professional end models from Trimble and Magellan, with our old friends the with Garmin eTrex for backup, and manually read and re-digitized the collected latitude / longitude into the database. Data analysis was undertaken in 2010.
Nairobi and other urban areas were particularly challenging. Especially slums — slums are dense, and its sometimes hard to get a signal. The teams had a lot of data to collect, and were in a hurry. To reach many slum schools, you must walk. It’s hard to access by vehicle, often impossible, and it can be uncomfortable and difficult (or even dangerous) for outsiders to roam. This is just conjecture by me, but in searching for a reason, perhaps sometimes the team did not get out of the vehicles. Manual re-entry can also introduce errors. In any case, it seems some factor conspired to introduce some inaccuracies into the schools, especially within informal settlements.
The objective of the project was to go further, and essentially, to set up the Ministry of Education to manage this data better in the future. There are numerous departments like the Information Management Office, and Planning & Quality Assurance, and systems even within the Ministry of Education which don’t keep consistent and linked databases. One key thing they did was assign every primary and secondary school a unique identifier to help with this. Curiously, only the secondary school identifiers made it into OpenDataKE. Ultimately, the hope was to merge all education databases, including the Teachers Service Commission (TSC) which keeps information on teachers, and Kenya National Examinations Council (KNEC). There is even apparently a photo database of each school within the MoE.
I was left with the impression that the challenges in the work Map Kibera has taken on — to link and update school databases in one place — are real ones the Ministry of Education has itself grappled with at a much larger scale. And, I  appreciate much more the impressive challenge of collecting such data for an entire country. This data story reveals an opportunity … if we can find a way for our Open approach to grow, perhaps to county level, then there’s a real repeatable method for keeping school data linked, accurate and up to date. We can take advantage of new networked data collection methods, distributing the cost of data collection to manageable places and to schools themselves.