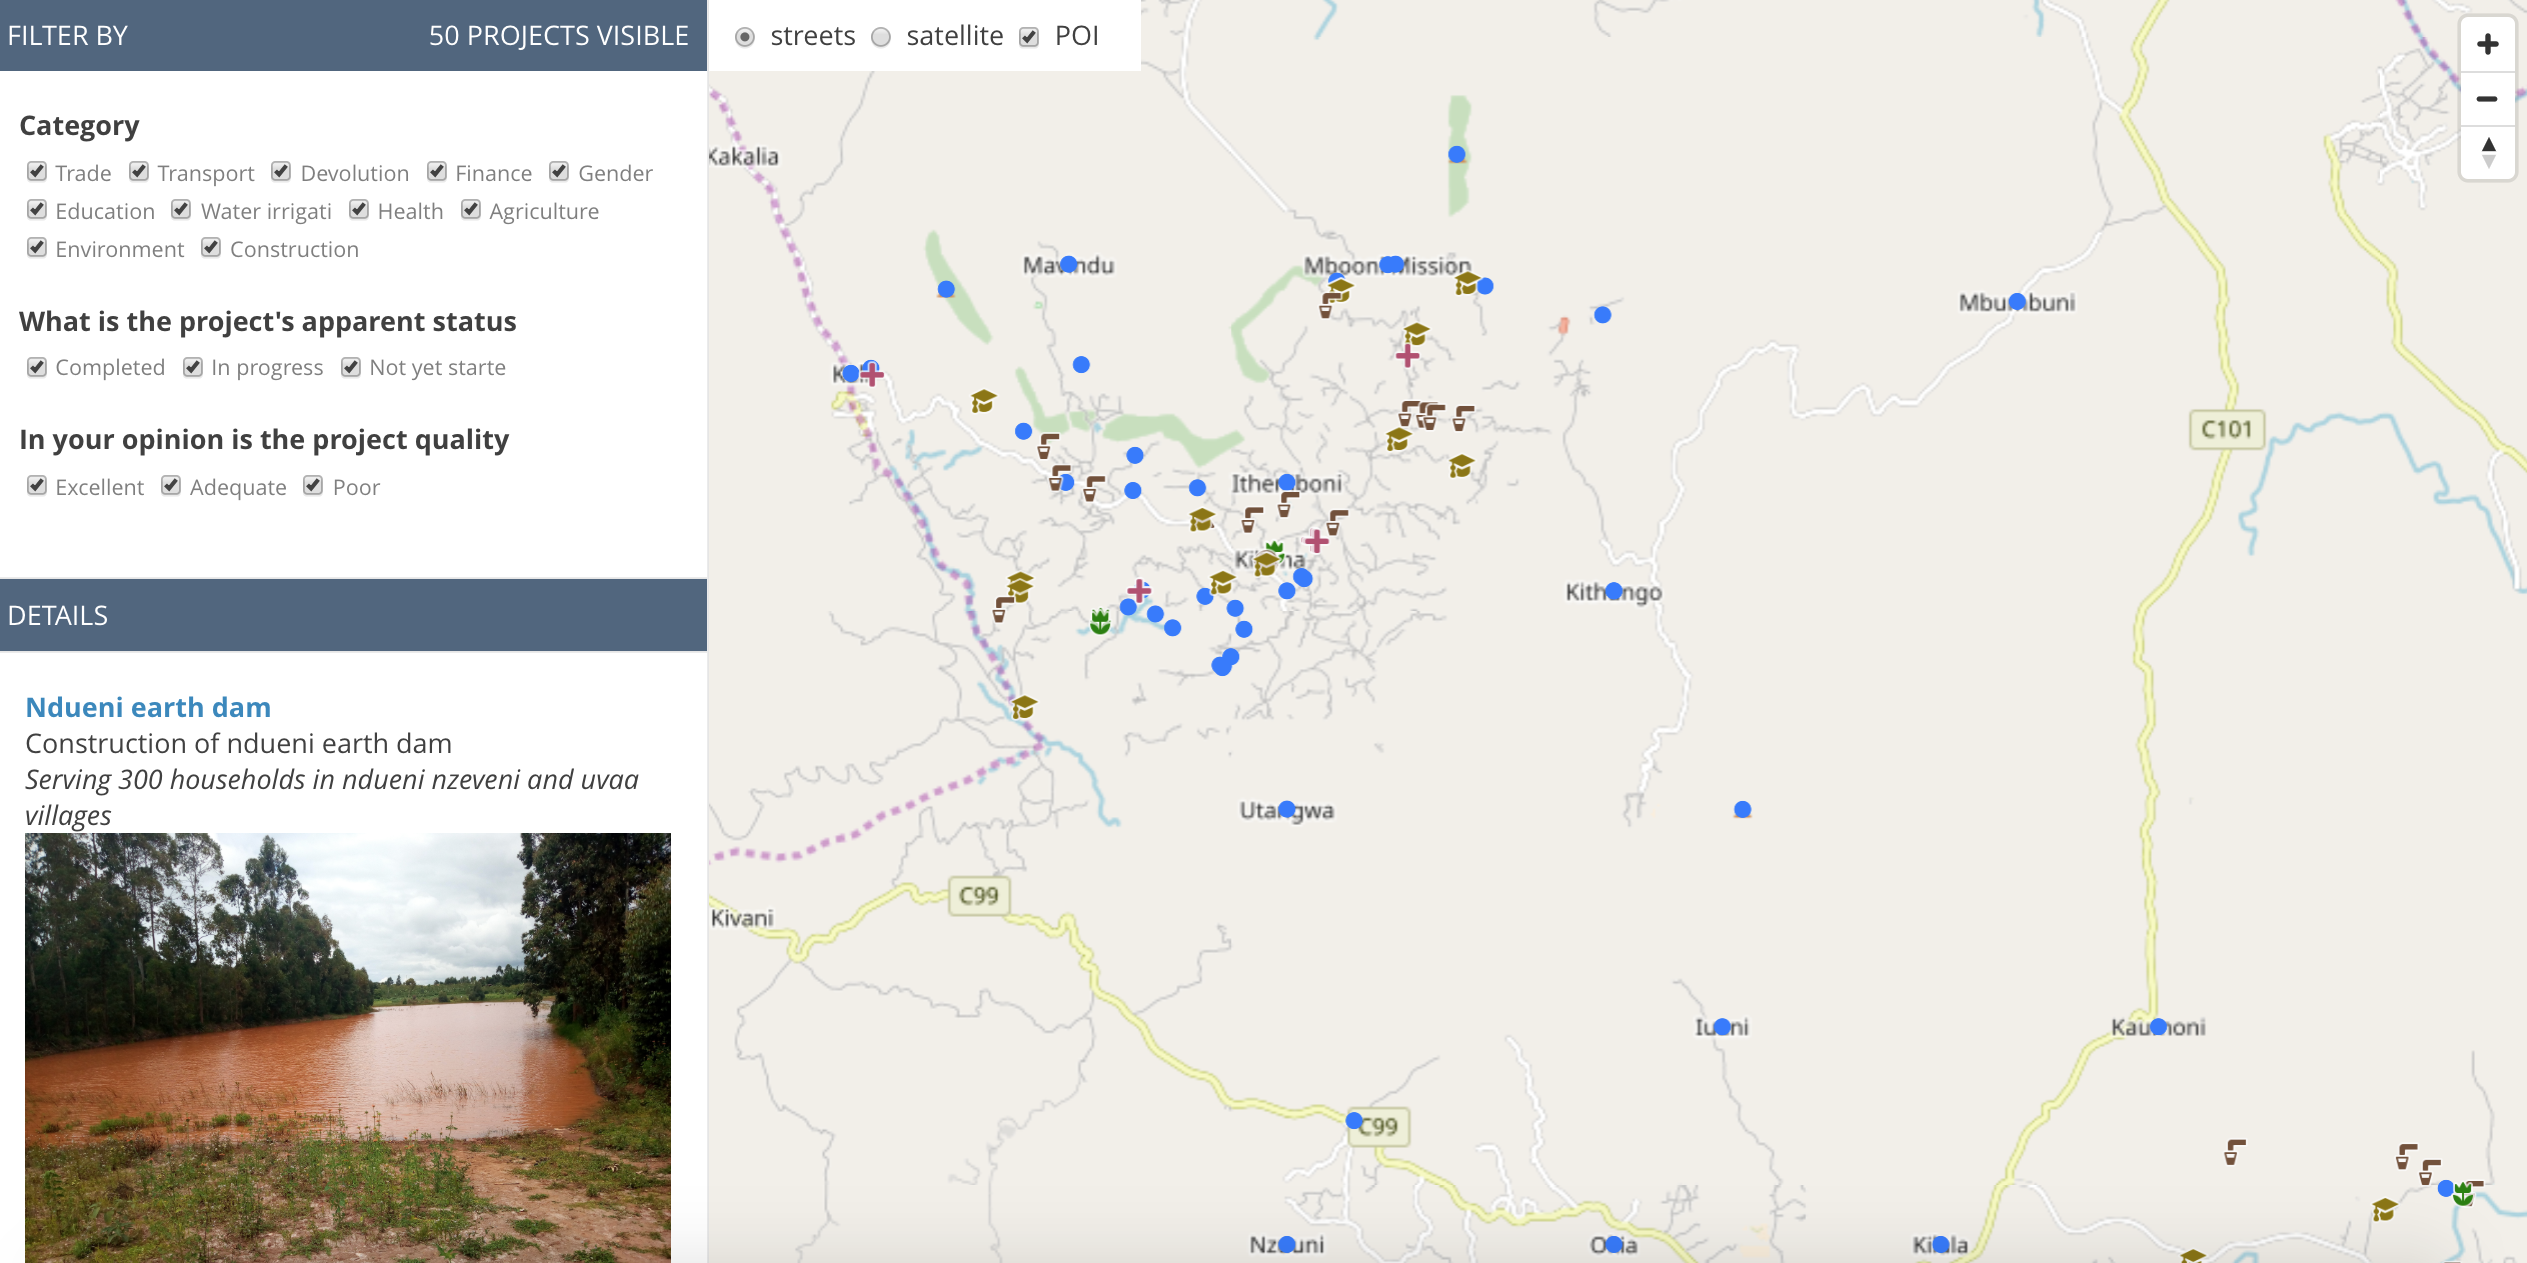
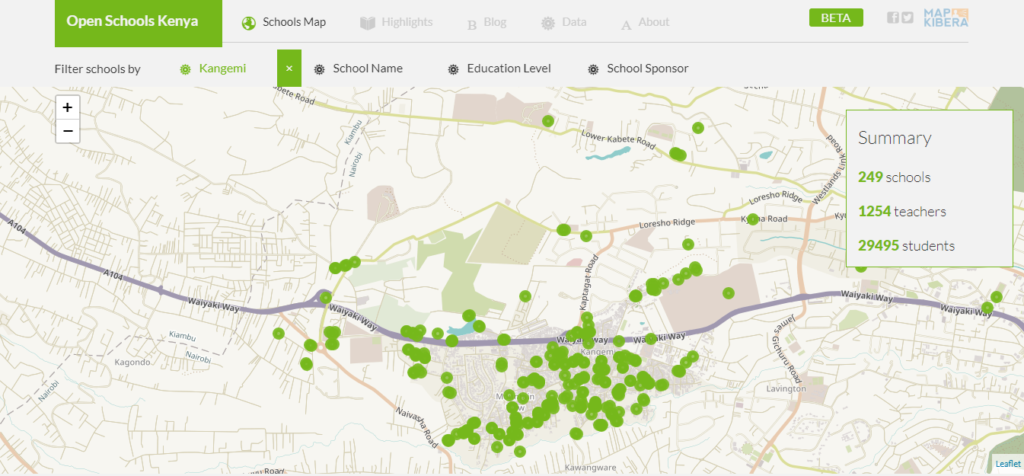
The schools mapping of the Kangemi slum and associated surroundings was a very successful exercise, and provided much-needed information for everyone from Kangemi’s residents and parents to policy advisers and education experts to governmental education officials. The project brought together youth residents of Kangemi with Map Kibera mappers, who, working closely with local school leaders and advocates for informal schools, mapped nearly 300 schools. These now appear on Map Kibera’s Open Schools Kenya school database. The mapping exercise, possible thanks to the support of Indigo Trust, has brought visibility to these schools, and increased both information and knowledge about the number and kind of schools in Kangemi. It has also equipped schools and activists with a key resource in advocating for improvements to and recognition of these schools.
Just like in Kibera, before the project began, Map Kibera conducted a survey with parents, teachers and government officials to try and understand the information gap in regards to education. Parents, for example, were interested in the distance of a school from their home, how much a school charges, and the ratio of teachers to students before selection a school for their children. Other data points that were collected included the number of students, availability of toilet, school building materials, electricity availability, number of teachers, and many more.
Map Kibera also talked to teachers and school leaders, and met with a number of important figures in Kangemi education. Particularly supportive throughout the exercise was Kangemi’s Alternative Provision of Basic Education and Training (APBET) coordinator, Evans Onchiri. Evans is a tireless advocate and organizer on behalf of the schools, and he particularly welcomed the addition of detailed data and maps to better support APBET schools (APBET is what the schools are now called which were previously known as “informal” or “non-formal”). Map Kibera found that although there is a government policy to recognize these schools — which would allow them to access more resources, have some oversight in place, and be part of the provision of free basic education guaranteed by law to all children — the process of registering under the policy is not clear and has been stalled over several years. Having a better idea of the number of students served and locations of these schools is essential to pushing forward on this policy. The Sub-County Education Director, Phillip Chirchir, and the area Member of Parliament (MP), Tim Wanyonyi also indicated to Map Kibera that they needed a more comprehensive understanding of the schools in their area.
The schools mapping exercise covered both the schools already on local leaders’ lists, and also unknown schools found directly in the field. From the initial main focus areas of Kangemi, which included Kangemi ward and Mountain View ward, the schools mapping exercise was expanded to other slum areas, following the request of the Sub-County Education Director and the area Member of Parliament. The additional mapped areas are the following: Kibagare slum, Deep Sea slum, and Githogoro slum. All the mapped areas fall into the Westlands Sub-County. The total number of the mapped schools is 282, out of which only 19 are public schools, including pre-primary, primary and secondary levels. Therefore, the majority of schools (263) are APBET schools.
A few outcomes:
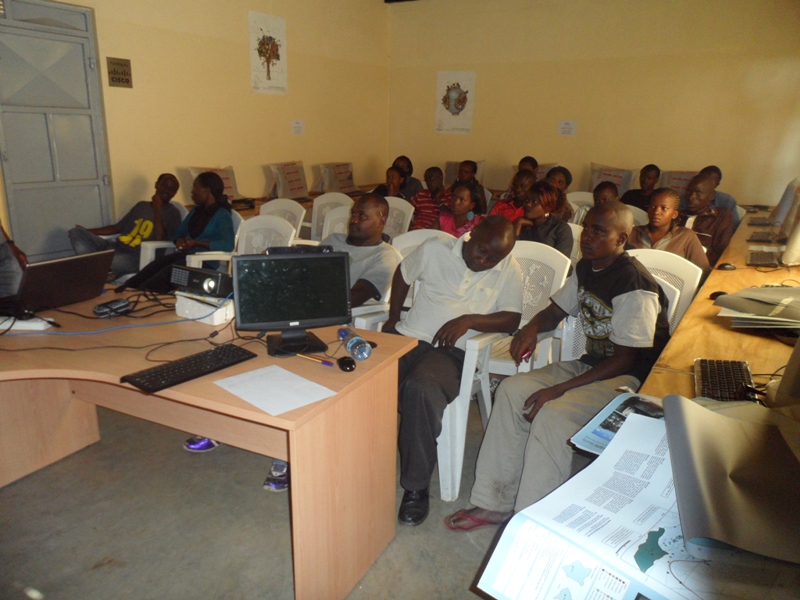
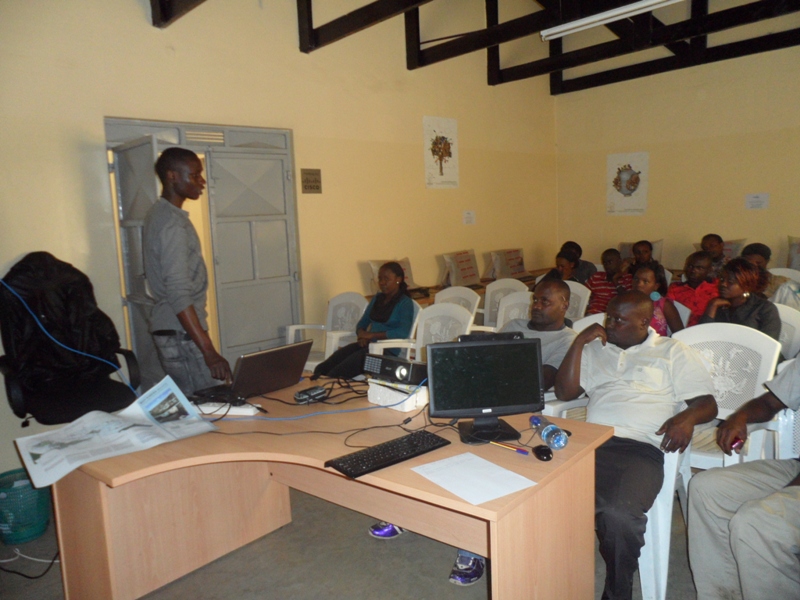
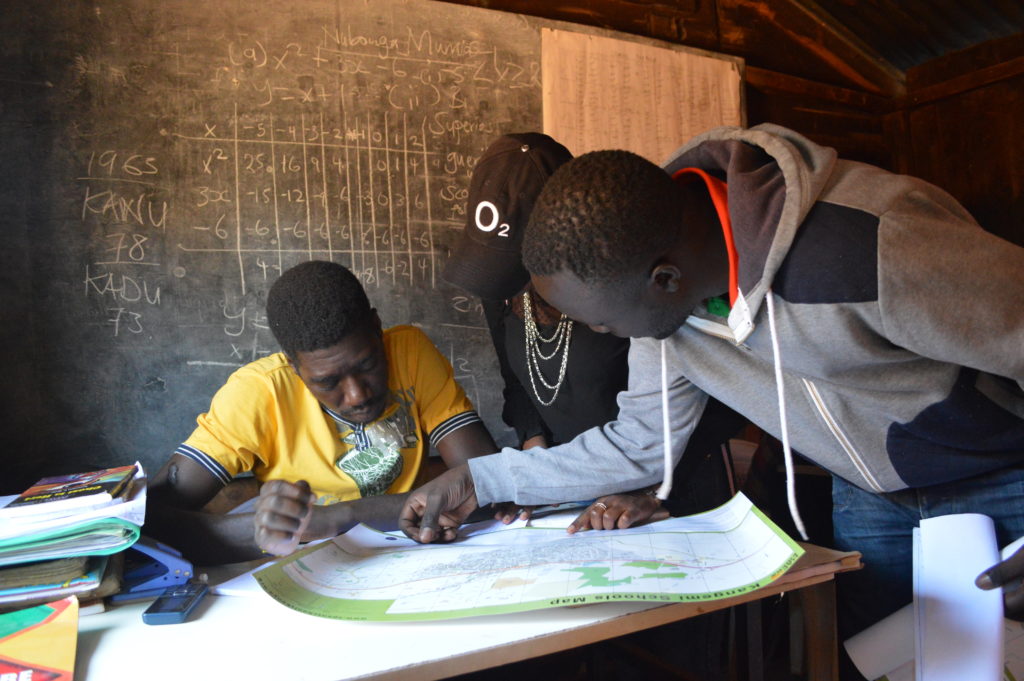
Seven youth have been trained in Kangemi on how to collect data using the OpenDataKit app, how to edit maps using JOSM software, and how to upload data onto OpenStreetMap. The youth reported a general satisfaction about the additional skills learned. After the completion of their work, the youth mappers reported raised awareness and general knowledge about their own community. Moreover, the new team of trained mappers in Kangemi could be further involved in updating schools’ information and in other related local developments.
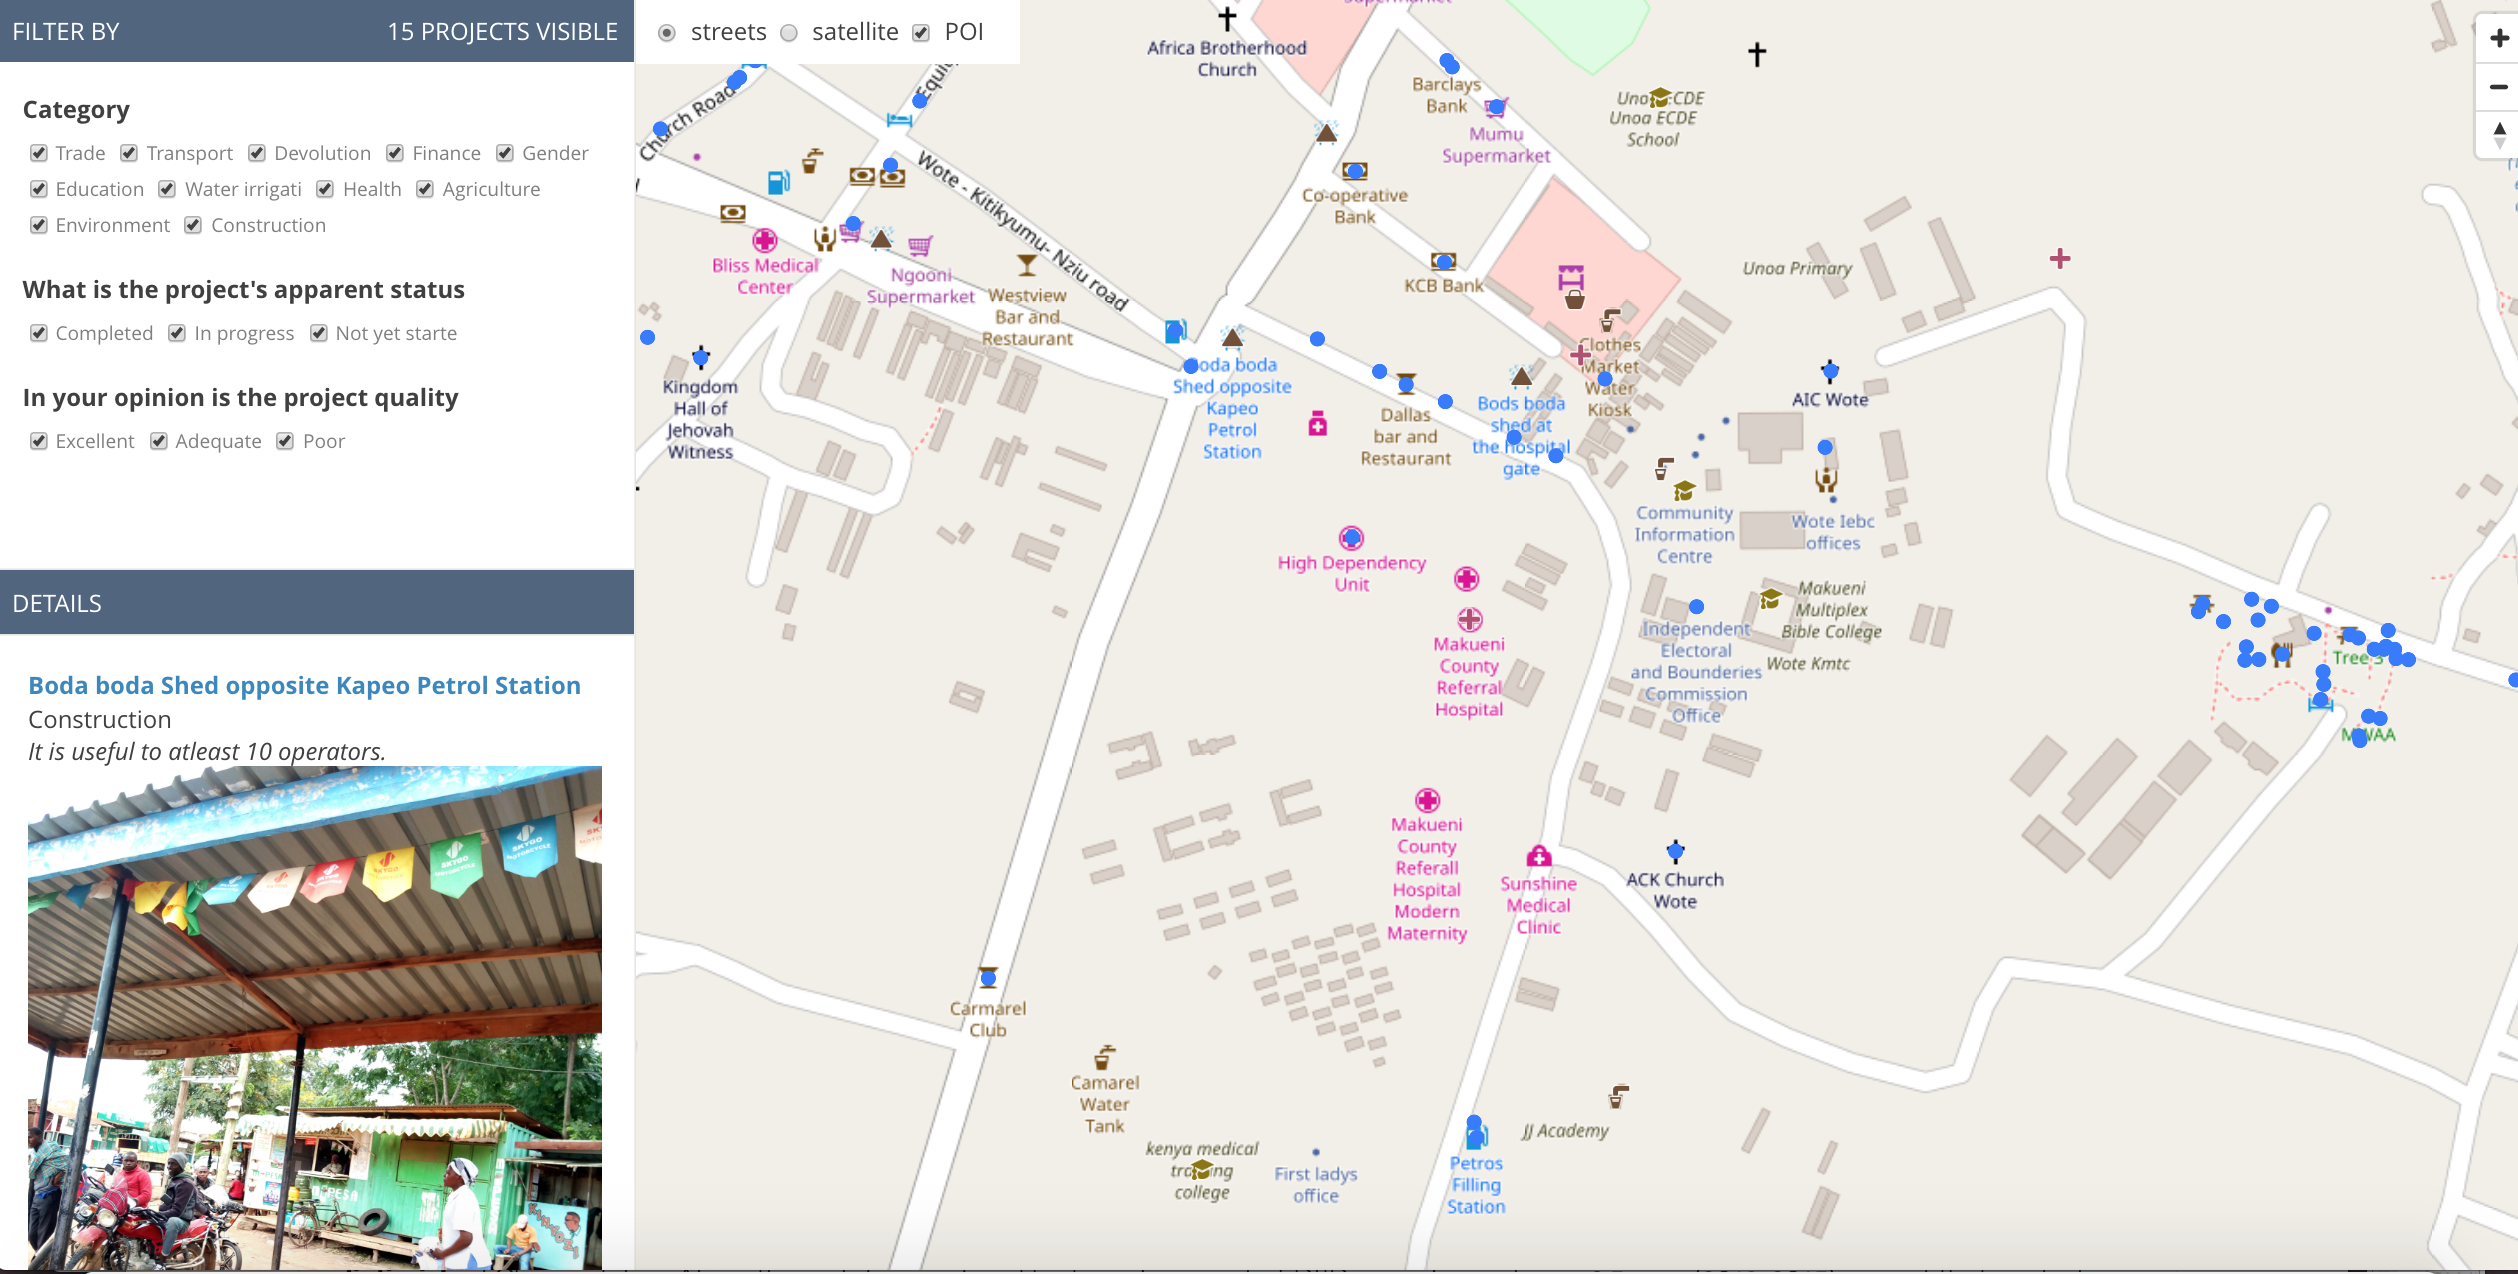
The website Open Schools Kenya has been made mobile-friendly so that it can be easily viewed and used on a smartphone. Previously, due to the difficulty navigating a map on a small screen, the site was best viewed on a laptop. Thanks to feedback from users at schools, we prioritized making sure that they can also navigate the site using their phone’s mobile browser. This makes the data much easier to access. Additionally, we worked on the submission form for data corrections, making it more user-friendly and better suited to the needs of schools to submit changes.
The schools and teachers have been very happy about the project. In the first phase, they reported interest in knowing the location of their own school and of the other schools in the area, in particular, to better know the number of pupils, the facilities and the services provided by the other schools. After the mapping exercise was completed and the schools received the printed map, they reported surprise at being able to see the outcomes of the project. In fact, during past experiences, many researchers went in the area collecting data without going back afterward for community restitution and feedback. Moreover, they reported general excitement for being able to locate their own school on the map and to be able to display the printed map in their office for multiple purposes. The schools also highlighted the importance of the online school page. Having their own specific page on OSK, they are now able to easily update the information, advertise and fundraise for their school, and also help engage parents in the community in decision-making about where to send their sons and daughters to school and increase the quality of their education.
Key local education officials were particularly pleased with the outcomes of the mapping exercise. Both Ms. Esther Kimani, the Sub County Quality Assurance Officer, and Mr. Phillip Chirchir, the Sub County Director of Education, highlighted the importance of being able to locate the schools, especially APBET schools, and to have the head teacher’s contact for each school on the OSK website. They are now able to better reach out to the schools and advise the Ministry of Education about their needs.
Map Kibera is now collaborating with education specialists from local organizations Each Rights and African Population and Health Research Centre (APHRC) to include the data and findings of the mapping in their advocacy and policy advising. With their assistance, already Map Kibera has presented the schools’ map to the National Council for Nomadic Education (NACONEK), which oversees APBET country-wide, at a joint meeting discussing schools information and potential mapping of all the APBET schools in Nairobi. Map Kibera has also been working with the Kangemi Resource Centre, a local CBO, to establish a workspace for the Kangemi mappers and to develop joint plans for updating the schools’ data regularly. All three of these key partners also presented at the launch event, which allowed them to connect with the various Kangemi school leaders and share some of their advocacy work.
The schools mapping in Kangemi and beyond led to an increased awareness of existing schools and resources within the community itself. As a teacher from a school in Githogoro slum stated, the schools in these marginalized areas are usually left out from development in Westlands. Both the map and the website are therefore crucial to make visible and clear their presence in order to assure their inclusion into the public education system and the overall education policymaking and planning.