by: Steve Banner March 6th, 2024 comments:
Mapping waste management in Mukuru Kwa Ruben was an eye-opener to the challenges most people face in our informal settlements in Nairobi, where potential talents and opportunities go unrecognized and a lot of people are not aware of the resources availed to them.
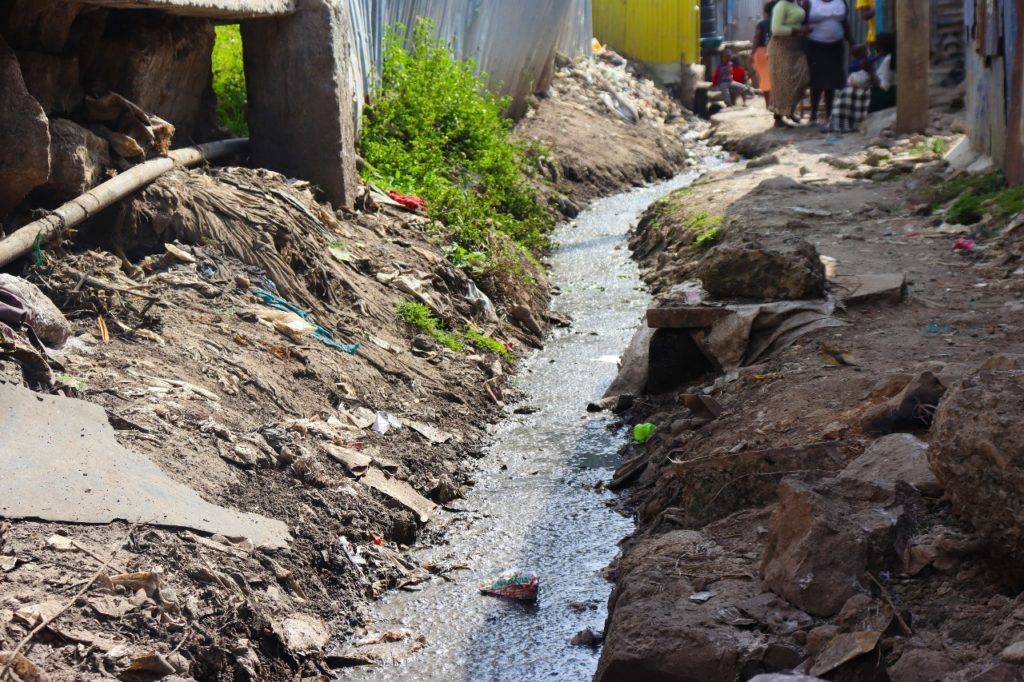
One of the many open drainages crisscrossing the area and offsetting waste into the nearby river.
Mukuru Kwa Ruben is said to be a government reserve for mining industries and that was displayed during our recent waste management mapping where we frequently came across a group of young people working on mining residues to make money.
Like any other informal settlement in Nairobi, Mukuru battles with how to handle their waste and most end up in the drainage system, with a high risk of a dirt-related disease outbreak.
Our mapping started in late December 2023, and went on for about three weeks, which saw it end in mid-January 2024.

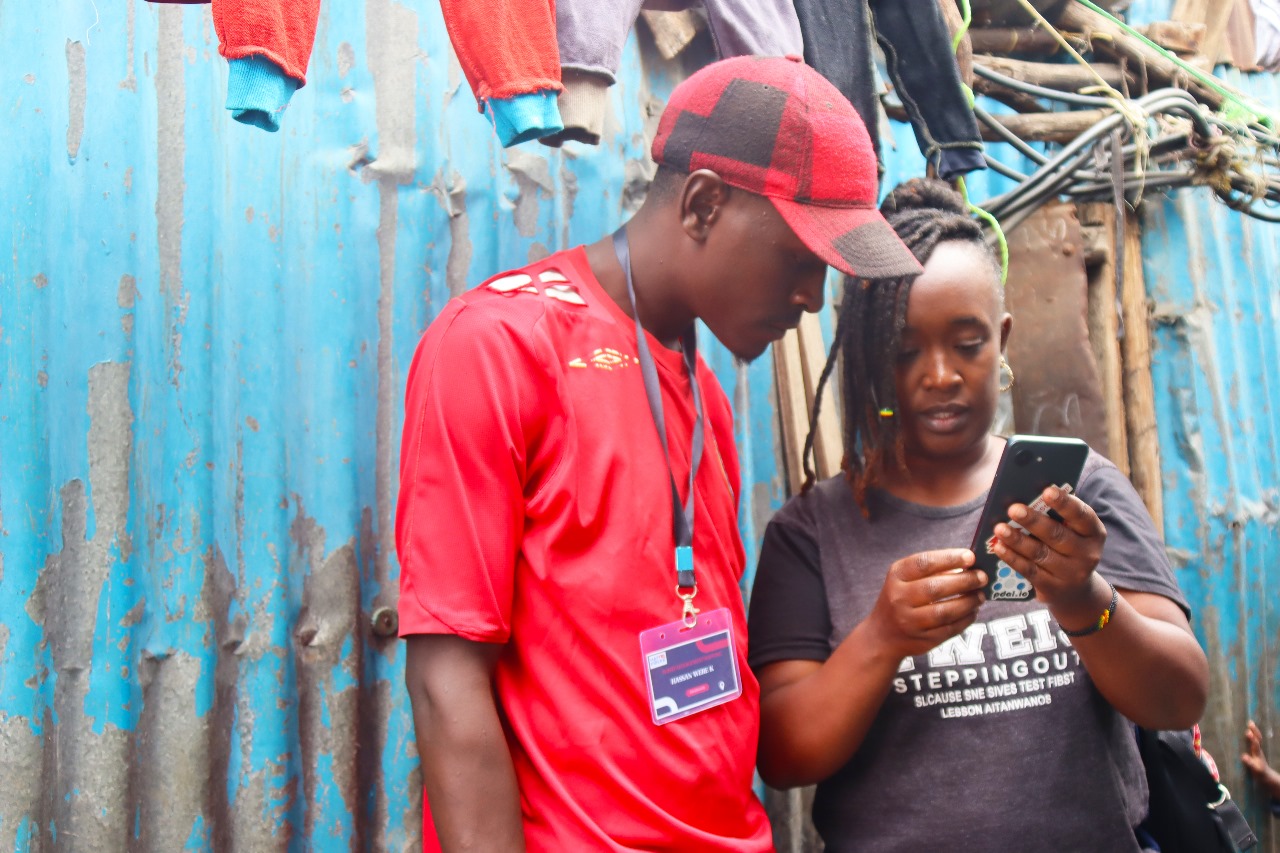
Our field coordinator Lucy demonstrating to one of the enumerators how to pick accurate gps coordinate.
With a group of about 20 youths from Mukuru kwa Ruben, affiliated to Mukuru Youth Oasis CBO, We mapped over 2000 households from Zone A, B, C & D of Rurie village and what stood out the most was the cooperation of the residents and their willingness to have a clean environment.
One of their biggest fear was how the installed bins were going to be managed, most residents could not believe that they were being given quality dumping bins for free.
“Who is going to empty the bins when they are full, and who is paying for that?”, were some of the questions the residents demanded answers for, other than that, they welcomed the idea of having recycle bins in every household of Rurie village.
The mapping was conducted by counting the blocks and finding out how many households and businesses were in a particular block, which helped us determine how many bins to be installed in a particular block.

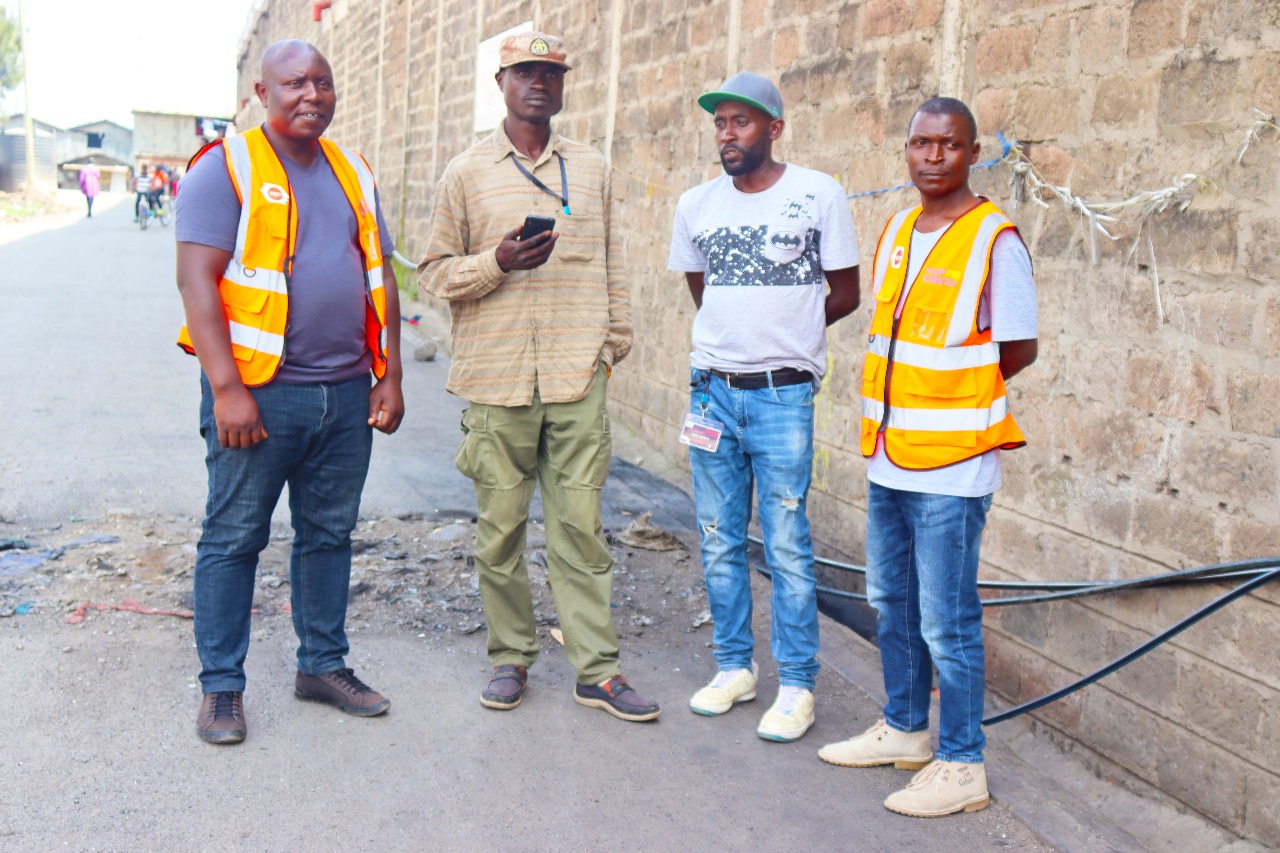
Some of the youths and leaders of Mukuru Youth Oasis CBO
From the success of this particular mapping exercise in Rurie village, I’m hoping that Map Kibera, together with the partners, will scale to other villages of Mukuru kwa Ruben and by extension, into other informal settlements in Nairobi who are also battling with the challenge of waste management.
by: primoz July 5th, 2011 comments:

Paper mapping
The approaches to paper mapping are well described by Mikel in his blog post called Paper Mapping in Community Meetings. What I would like to add to his points are the reasons why we conducted the paper mapping in the first place. To name a few:
Feedback. To acquire feedback from the wider community regarding the maps and the data collected by a few community members.
Understanding the place. To understand the areas where we are mapping – more accurately, to at least trying to understand complex places like Kibera. Outsiders to communities often overlook this step, and end up conducting projects in communities that they don’t really understand and haven’t taken the time to learn much about.
Acquire more information. We wanted to collect more information and double-check the information collected, find the missing objects, listen to the stories regarding particular issues, and to identify specific problems and solutions to these problems.
Monitoring the accuracy of the mapping. Through community’s input we were able to monitor the accuracy of our mapping endeavor.
These were the reasons I decided I’m going to look closely into these paper/drawn maps and try to understand what the people from Kibera were telling us. I’ve done a similar exercise before with Joshua Goldstein (as a part of Map Kibera) who was at that time working for UNICEF Innovations. We – together with the rest of the Map Kibera team, of course – had created the first, and the most comprehensive Security map of Kibera. Now it was time to focus on other problematic areas, where we also involved community members who drew on our existing map to add information and new issues. For that reason, there were, and still are, some twenty or so drawn, paper maps stored safely away in cyberspace, which cover issue topics ranging from education, health, water and sanitation. To extract useful information from these maps required some Photoshop magic. The first maps I looked into were the water and sanitation maps.
So what did we ask, and what did the community tell us?
Identifying missing resources:
Is it representative?Is anything missing or mislabeled?†were some of the questions we asked to help us see the extent of the missing data. The feedback made us realize that we missed a lot, and it made us realize we need to re-do the mapping.

Missing
Identifying problem areas:
What and where are the biggest problems regarding water and sanitation in the community? Which water points and toilets would you say are the worst and why? Are there many people who use public spaces for toilets?†were the questions which helped us identify the most pressing issues and problems. Some of the major problems identified were:

Major problems/issues
- All streams are used as toilets and dumping sites
- There is a health hazard because the people at times use the railway as a toilet, garbage dump & a cooking point
- Misuse of the drainage system as a dumping site
Stories behind issues:
What would you say are the largest and most direct challenges to providing quality water and sanitation? What is the biggest need regarding water, waste disposal, and sanitation in Kibera? What would you want the Government and other decision makers to know about water, waste disposal, and sanitation in Kibera?†These questions helped us collect stories that lent insight into the complex dynamics of Kibera. Some stories:

Stories connected to water and sanitation
- Different amounts of money is required depending on which toilet you use
- Solid waste management is poor
- Vigilante groups demand money for the toilets which are to be constructed in their area
- Maintenance of toilets is a big problem; toilets get polluted quickly
- For “short calls†people use plastic tins; flying toilets (plastic bags in which people defecate and then throw out of their home) are used at night because of insecurity
- Households use paper bags for waste collection; these bags are then picked up by individuals and groups who bring them to collection points for a certain amount
Mapping mobility:
Where do your collect water? Where do you use the toilet? Where do you dump trash? Why?†By asking these questions we were able to observe the movements connected to the water and sanitation. Some of the findings that came out of the mobility mapping were that:

Mobility connected to water and sanitation
- People dump their trash into rivers, and the rivers serve as collectors of most of the garbage from the slums
- There are some points of data collection within the slum where the city council collects the trash and transports it out of the slum
- People don’t necessarily use the closest toilets and water points but look for the most affordable ones
Solutions:
How would you solve some of the problems you pointed out? In what ways can you envision using this map to improve water, waste disposal, and sanitation in Kibera?†These questions encouraged people to share their views on how to solve certain problems regarding water and sanitation:

Some of the solutions
- Awareness and education
- Need for weekly garbage collection
- More dumping sites, more toilets to be constructed
- Stakeholder involvement – coordination between stakeholders
- Partnership involvement – CBOs, NGOs, and landlords should come on board to make sure that each plot has a sanitary facility/usable toilet
- Triangle: Reuse, Recycle, Reduction programs needed
Paper mapping or drawing exercises proved to be a very useful feedback mechanism and also a very useful tool for planning. The community’s knowledge is priceless and only the community understands and knows all the answers. There’s no point in figuring out something new when the solutions are already available and when all you have to do is just listen!
What we learned out of this process can be best told by quoting an article:Â Participatory mapping and geographic information systems: Whose map? Who is empowered and who dis-empowered? Who gains and who loses? by professor Robert Chambers from the Institute of Development Studies who has been involved with participatory methodologies from the early beginnings, or at least from the first modern scientific endeavors in the field of participatory methodologies:
Before the late 1980s and early 1990s when some of us were so excited at what we were finding local people could do, much indigenous, local and participatory mapping had already taken place in different regions, countries and continents. Mapping and various forms of spatial representation by local people on their own have a long history, and very likely a prehistory!
More remarkable than what local people had already done in mapping and other forms of spatial representation was “our†educated professional ignorance of their mapping abilities.
[Cross-posted from Mapping: No Big Deal]
by: primoz April 4th, 2011 comments:

Open Drainage
I believe that the reasons to map open drainage in the slums are well known and are obvious to most people. Everyone who’s ever been to the slums knows that open drainage presents a huge health hazard to the people living around it. In combination with poor or non-existent water and sanitation systems, open drainage presents a recipe for disaster which is always present and can erupt at any time and wreak havoc amongst the populations. If I quote a few experts on the dangers that open drainage poses:
“Potholes in the streets, pools of stagnant water, and waste gushing from bathrooms and kitchens provide breeding sites for malarial mosquitoes and other spreaders of disease.†(Nwaka, Geoffrey I. “The Urban informal Sector in Nigeriaâ€)
“Most slum households must fetch their water from a standpipe and deposit their waste in open drains. The rate of infection is high; therefore there is constant risk of epidemic.†(Gulis et. Al. “Health status of people of slums in Nairobi, Kenyaâ€)
“In slum areas, a minor flood is not just inconvenient. It is life-threatening. With open drains and overflowing latrines even a small flood means that children have to wade through raw sewage.†(Willem Alexander, HRH, Chair of UNSGAB. “World Water Day Op Edâ€)
In an article on the health status of people of slums in Nairobi, Kenya the authors conclude that: “Environmental conditions can have major influences on health status. Therefore, environmental improvements are important in the improvement of health status.†(Gulis et. Al. “Health status of people of slums in Nairobi, Kenyaâ€)
As my friend Simon, a long-time resident of Mathare and our Map Mathare Coordinator, put it on the Mathare Valley blog: “One does not need to be a scientist to know what would happen in case of disease outbreak. The improvement of proper water distribution and repairing the broken water pipes coupled with constructing good drainage system is the key to fighting common illness in the slums.â€
What I can add to all of this is that in order to improve or at least start improving living conditions, you need to first know and understand the situation on the ground. By mapping open drainage areas, our mappers are providing the first detailed geographical information about how open drainage is distributed throughout Kibera and Mathare, thus providing necessary information to anyone hoping to solve the problem.
This I believe answers the question of why and brings me to the next question: How?
Obviously open drainage creates “appalling living conditions,†but maybe not so obviously, it creates appalling mapping conditions too! Open drainage winds and curves between houses, often sinks below them, intersects, flows, stands, overflows, merges with the content of broken sewage lines (sewage lines burst and sewage comes above ground, mixing with the content of open drainage), and creates pools of standing water. Open drainage is the main collector of garbage: garbage in open drainage areas often clogs drainage systems, thus creating floods during rains. All of this mesh slowly flows downwards, usually towards rivers that pick it up and carry it further downstream, polluting the environment sometimes hundreds of kilometers away.
In order to understand the scale of the problem in Mathare and Kibera we went on an investigative – or, if I put it in army terms, reconnaissance – mission with our teams to see the problem first hand. Our participants surveyed the problem, and their input helped us to better understand what we’re up against. We walked through the slum evaluating different drainage lines and problems we faced in mapping them, Sebastien (our new volunteer) and I then facilitated the mappers to decide on which points of interest we should collect and in what order.

Investigating the problem
Findings from the field regarding open drainage include:
- Open drainage has many sources and it forms for many reasons (resulting from topography and from human actions)
- It comes in many forms regarding the content and structure (garbage, water, sewage, earth trench, concrete trench, etc.)
- It has main channels with many tributaries
We came to realize that drainage systems in slums (Kibera, Mathare) basically work as micro river systems! This made us understand that it has to have an outlet, and both Kibera and Mathare have outlets in the form of rivers that run through them.
All of this helped us made our action plan:
- All the drainage flows towards the rivers, so we started collecting data along the rivers.
- The next step is to collect data for the main channels, which lie along the main paths.
- After this, we focused on the smaller paths in the slum, collecting points of interest along the way. This includes the start and end points for “following†a drainage line, intersections of different lines, man-holes (along sewage lines), and broken sewage lines. At intersections, we’re collecting the directions of different intersecting lines
- Throughout this process, the use of building extraction (when possible) helps us sketch the drainage lines
After the extensive data collection we’ll use the satellite imagery and building extraction to help us determine the exact positions of drainage lines.

Mapping Open Drainage
So, what’s next?
Just knowing and understanding the situation will not make it better. This means that our process cannot end with mapping, but will take the map and the information we collect a step further to actually make the information useful and create an impact. The next step is bringing together community members, stakeholders, NGOs, local administration and government representatives and expose the problem with a method I like to call: “A punch in the face†– where we present the problem, with maps and other media, in all its vastness, and hopefully get some heads thinking and acting upon the information which is presented. The map lets stakeholders present problems to responsible actors in a comprehensive and difficult to ignore manner, making the issues more concrete than just words by providing detailed geographical representations of their scope and characteristics.
In order for this last step to be successful, local ownership, insights, and understandings of both the issues at hand and how mapping and presenting information can help bring change, is crucial. Creating this local ownership amongst key stakeholders – namely the local Map Mathare and Map Kibera teams – has to start from the very beginning of the process. We are working hard to create this local ownership from the beginning in Mathare and to bring a greater sense of ownership to the Kibera teams.
Map Kibera and Map Mathare are currently involved in vast mapping operations regarding Water and Sanitation in both Mathare and Kibera, two of the biggest slums in Nairobi. These projects are big as the issues they are trying to address and will present test whether exposing vast quantities of information about a particular issue truly has the ability to influence change. As I often say: Collecting data, as complicated and hard as it may be, is the easiest part here.
[More of the same on Mapping: No Big Deal]