by: jamie October 4th, 2010 comments:

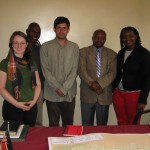
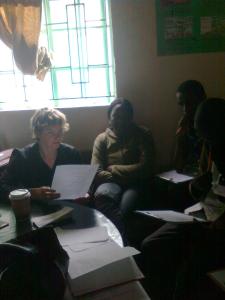
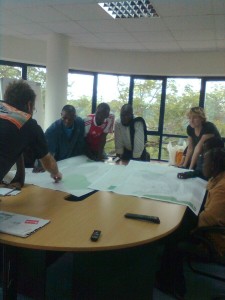
First steps in mapping Mathare: meeting partners & identifying allies. To that end, Primoz and I went along with Rose Nyawira, from Community Cleaning Services who will be involved in the Mathare mapping project, to meet with the District Officer (D.O.) of Mathare. We wanted to tell him about the Map Kibera programmes and the plan to facilitate knowledge sharing and transfer skills from youth in Kibera to youth in Mathare. Onserio, the D.O., was enthusiastic about the plans for putting Mathare on the map and how the data could be used by his office. He asked about the challenges and lessons learned from Kibera to ensure that we would apply the lessons learned in the Mathare work. Also at the meeting was John Kennedy Ogoi, a public health officer in Mathare who is also interested in h0w mapping and social media can support community health workers in the area. Our second meeting of the morning was with a group of 40 or so community health workers who were receiving training and discussing the community development strategy as it relates to public health. When we entered the room, I noticed the group had brainstormed and written on a flip chart the “Factors Hindering Health & Development” in the community. Their list contained many factors, but two jumped out at me
- Lack of individuals voice in decisions affecting them
- Illiteracy, lack of knowledge & skills
These are factors that training and materials that the Map Kibera team can directly address. The use of maps and information submitted through the community information sharing platform, including video reporting are powerful evidence that can be used to raise their voices and influence decisions affecting them. Data collection, mapping, improved spatial awareness, website & knowledge management, video production, etc are all concrete knowledge and/or skills that have impacted the lives of our team from Kibera and can and will address the factors identified by the community health workers . The positive response we got in the two short meetings, with the district administrators and then community health workers in Mathare, are (we hope) an indication of the enthusiasm of the people we will be working with in the area.
by: jamie April 13th, 2010 comments:
Day 1: What a way to start!
April 12th was day one of health service data collection with Map Kibera. Nine fearless mappers set forth to find out where in their community health and health-related activities are being carried out, what services are being offered, who is providing those services and much, much more. It was an eventful day – we learned quite a number of things and the data collection form is being modified to more accurately capture information during the rest of the week.

The Map Kibera project is becoming well-known outside of Kibera, Nairobi and even Kenya. Today, the team was asked to make a brief (but informative) presentation to the Executive Director of UNICEF, Ann M. Veneman during her visit to Kibera.


Day 2: Not a walk in the park.
Data collection is not a walk in the park. Day two of the health services mapping with Map Kibera brought to light two major challenges to systematic data collection.
I do not claim that these challenges are unique, nor that today was the first day the mappers came across these issues (in fact yesterday, and during the previous mapping exercise, the mappers expressed some of the same concerns):
1. Suspicion. People do not want to give up information about the services they are providing. This could be for many reasons (they don’t believe you are who you say you are, they think you are being exploitative, research fatigue -see below, they are not licensed to provide said service, etc.)
2. Research fatigue. From my (limited) experience in Kibera (I spent 3 months in the area in 2008 and have been back a few times in 2009 & 2010), the settlement is one of the most over-researched places in Kenya, if not in Africa. As an example, as we were walking around today, I saw 2 groups of researchers walking around with clipboards interviewing people door-to-door. And what ever comes of the research? Does the community see the benefits? Likely not in their eyes. As such, even groups such as Map Kibera doing ‘community research’ are viewed with suspicion…and the cycle continues.

- Reviewing the health services data collection form
[Both days are cross posted on my health geography blog]
by: jamie April 9th, 2010 comments:

- Map Kibera team reviews printed map (in draft stages) of their work
As the Map Kibera project moves into the second phase, the team’s mapping activities become more focused. For the next week mappers will be collecting Health Service data. They will concentrate on ensuring that all of the information pertaining to Health and Health Services is as detailed as possible and that it is accurate and up-to-date. That’s where I come into the picture. During the previous data collection phase, Health Facility information was collected, however it was not standardized. Using the Kenya Master Facilities List (MFL – a project of the Ministry of Health Services) as a guide, and the Wikipedia article on Healthcare in Kenya, a data collection form was developed to capture information about each individual Health Service located in Kibera.
An interesting point to note is that, at present, the MFL website does not include definitions for each facility type (i.e. what characteristics makes a Health Centre a Health Centre vs a Medical Clinic or a Nursing Home) and the website of the Ministry of Health Services is down. The Wikipedia article contained the most comprehensive information I could locate in terms of definitions. Additionally, the MFL project has not yet determined how to incorporate Community Based service provider data into their classification schema, not-to-mention how to go about collecting this data. The data collection guide the Map Kibera mappers will use is thus a modified version of the MFL classifications, tailored to the needs and realities of Health Services in Kibera.
Today, Mikel, Erica and I sat down with the mappers and had an in-depth discussion of the data collection form. It is this discussion of the realities of Health Services in Kibera that really intrigued me. As expected, the most challenging aspect of data collect will be determining which Service (or Facility) Type each point of interest really is. This is due in part to the lack of a clear, publicly available definition of characteristics for each service type, as well as the discrepancies between the medical community’s definition of each health facility and the community definition of the same facilities. For example, what exactly is a Health Centre? How many clinical officers or medical officers must be on staff at a Health Centre? How is this different from a Dispensary?
The most contested distinction was that of dispensary vs pharmacy vs chemist. In the MFL, only dispensaries are listed. Should all chemists and pharmacies and dispensaries thus be called dispensaries? The mappers were clear that the answer is “no”.
In Kibera, a pharmacy is a dispensing facility, usually located in a hospital; a dispensary can be large – as large as a Health Centre – and provide diagnostic and treatment services, or a dispensary can be small and serve functions, including but not limited to dispensing (no clear conclusion was reached on this); a chemist is a private operation that dispenses drugs (both prescription and over-the-counter drugs). One caveat – a chemist in Kibera often operates as a Medical Clinic, with an exam room in the back of the facility. The catch is that these ‘chemists’ are not licensed as clinics – often there is not even a certified pharmacist working in the “chemist” and the drugs are supplied to the facility by people who work at the larger hospitals outside Kibera and are seeking to make a profit by selling drugs at a cheaper cost inside the informal settlement.
How can these distinctions be visualized on a map? Should they be? What is the role of such ‘backdoor’ operations? Which definition should be used in order to add value to other on-going processes while also ensuring that the data are valuable to the local community? This is food for thought.
Another point of interest for me is that a Nursing Home (which in North America is a rest home for the elderly) in Kenya functions as a large, well-equipped, privately owned hospital. The mappers all knew exactly what a Nursing Home is, and did not need to hear the Wikipedia definition (which I did not even clearly understand).
This just goes to show, things are not always what you expect them to be.
[Cross-posted on my Health Geography blog.]


