Map Kibera recently embarked on the training of high schools in using OpenStreetMap and basic skills in open mapping. In partnership with YouthMappers the training has been customized to go beyond mapping since it aims to promote capacity building that will prepare high school students to join the competitive tech world.
The pioneer school benefiting from this OSM training is called Kibera Girls’ Soccer Academy (KGSA). It is located in Makina village in Kibera.
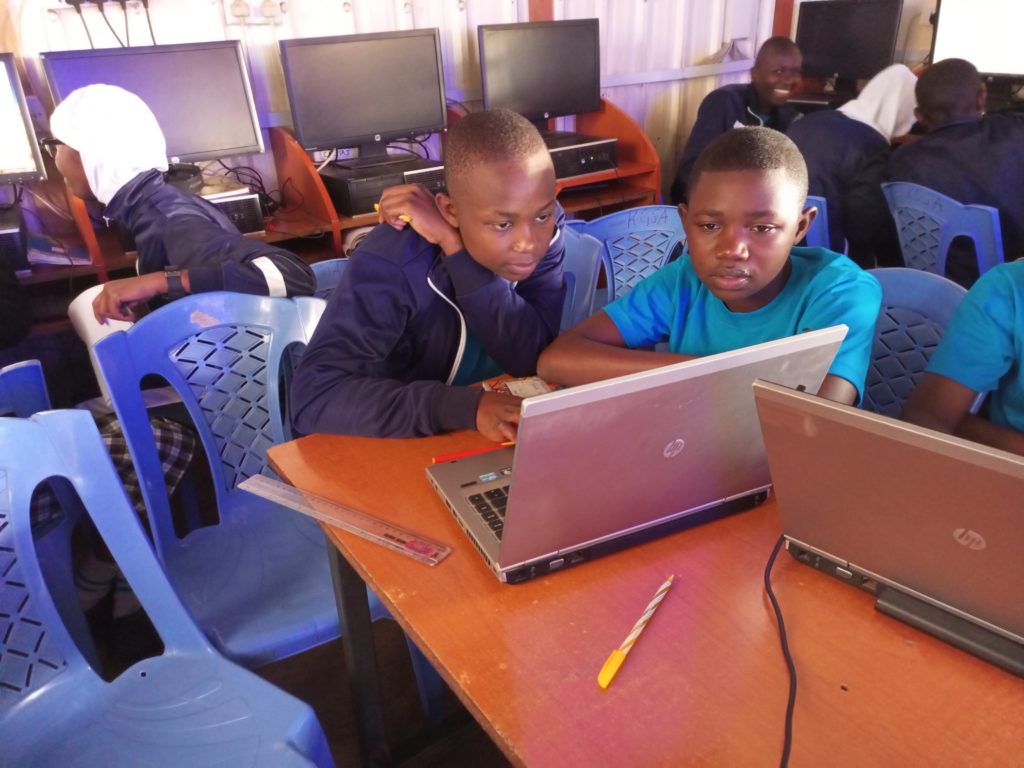
The school is among the few in the slum that has a decently equipped computer lab in which the students can hone their technical skills.
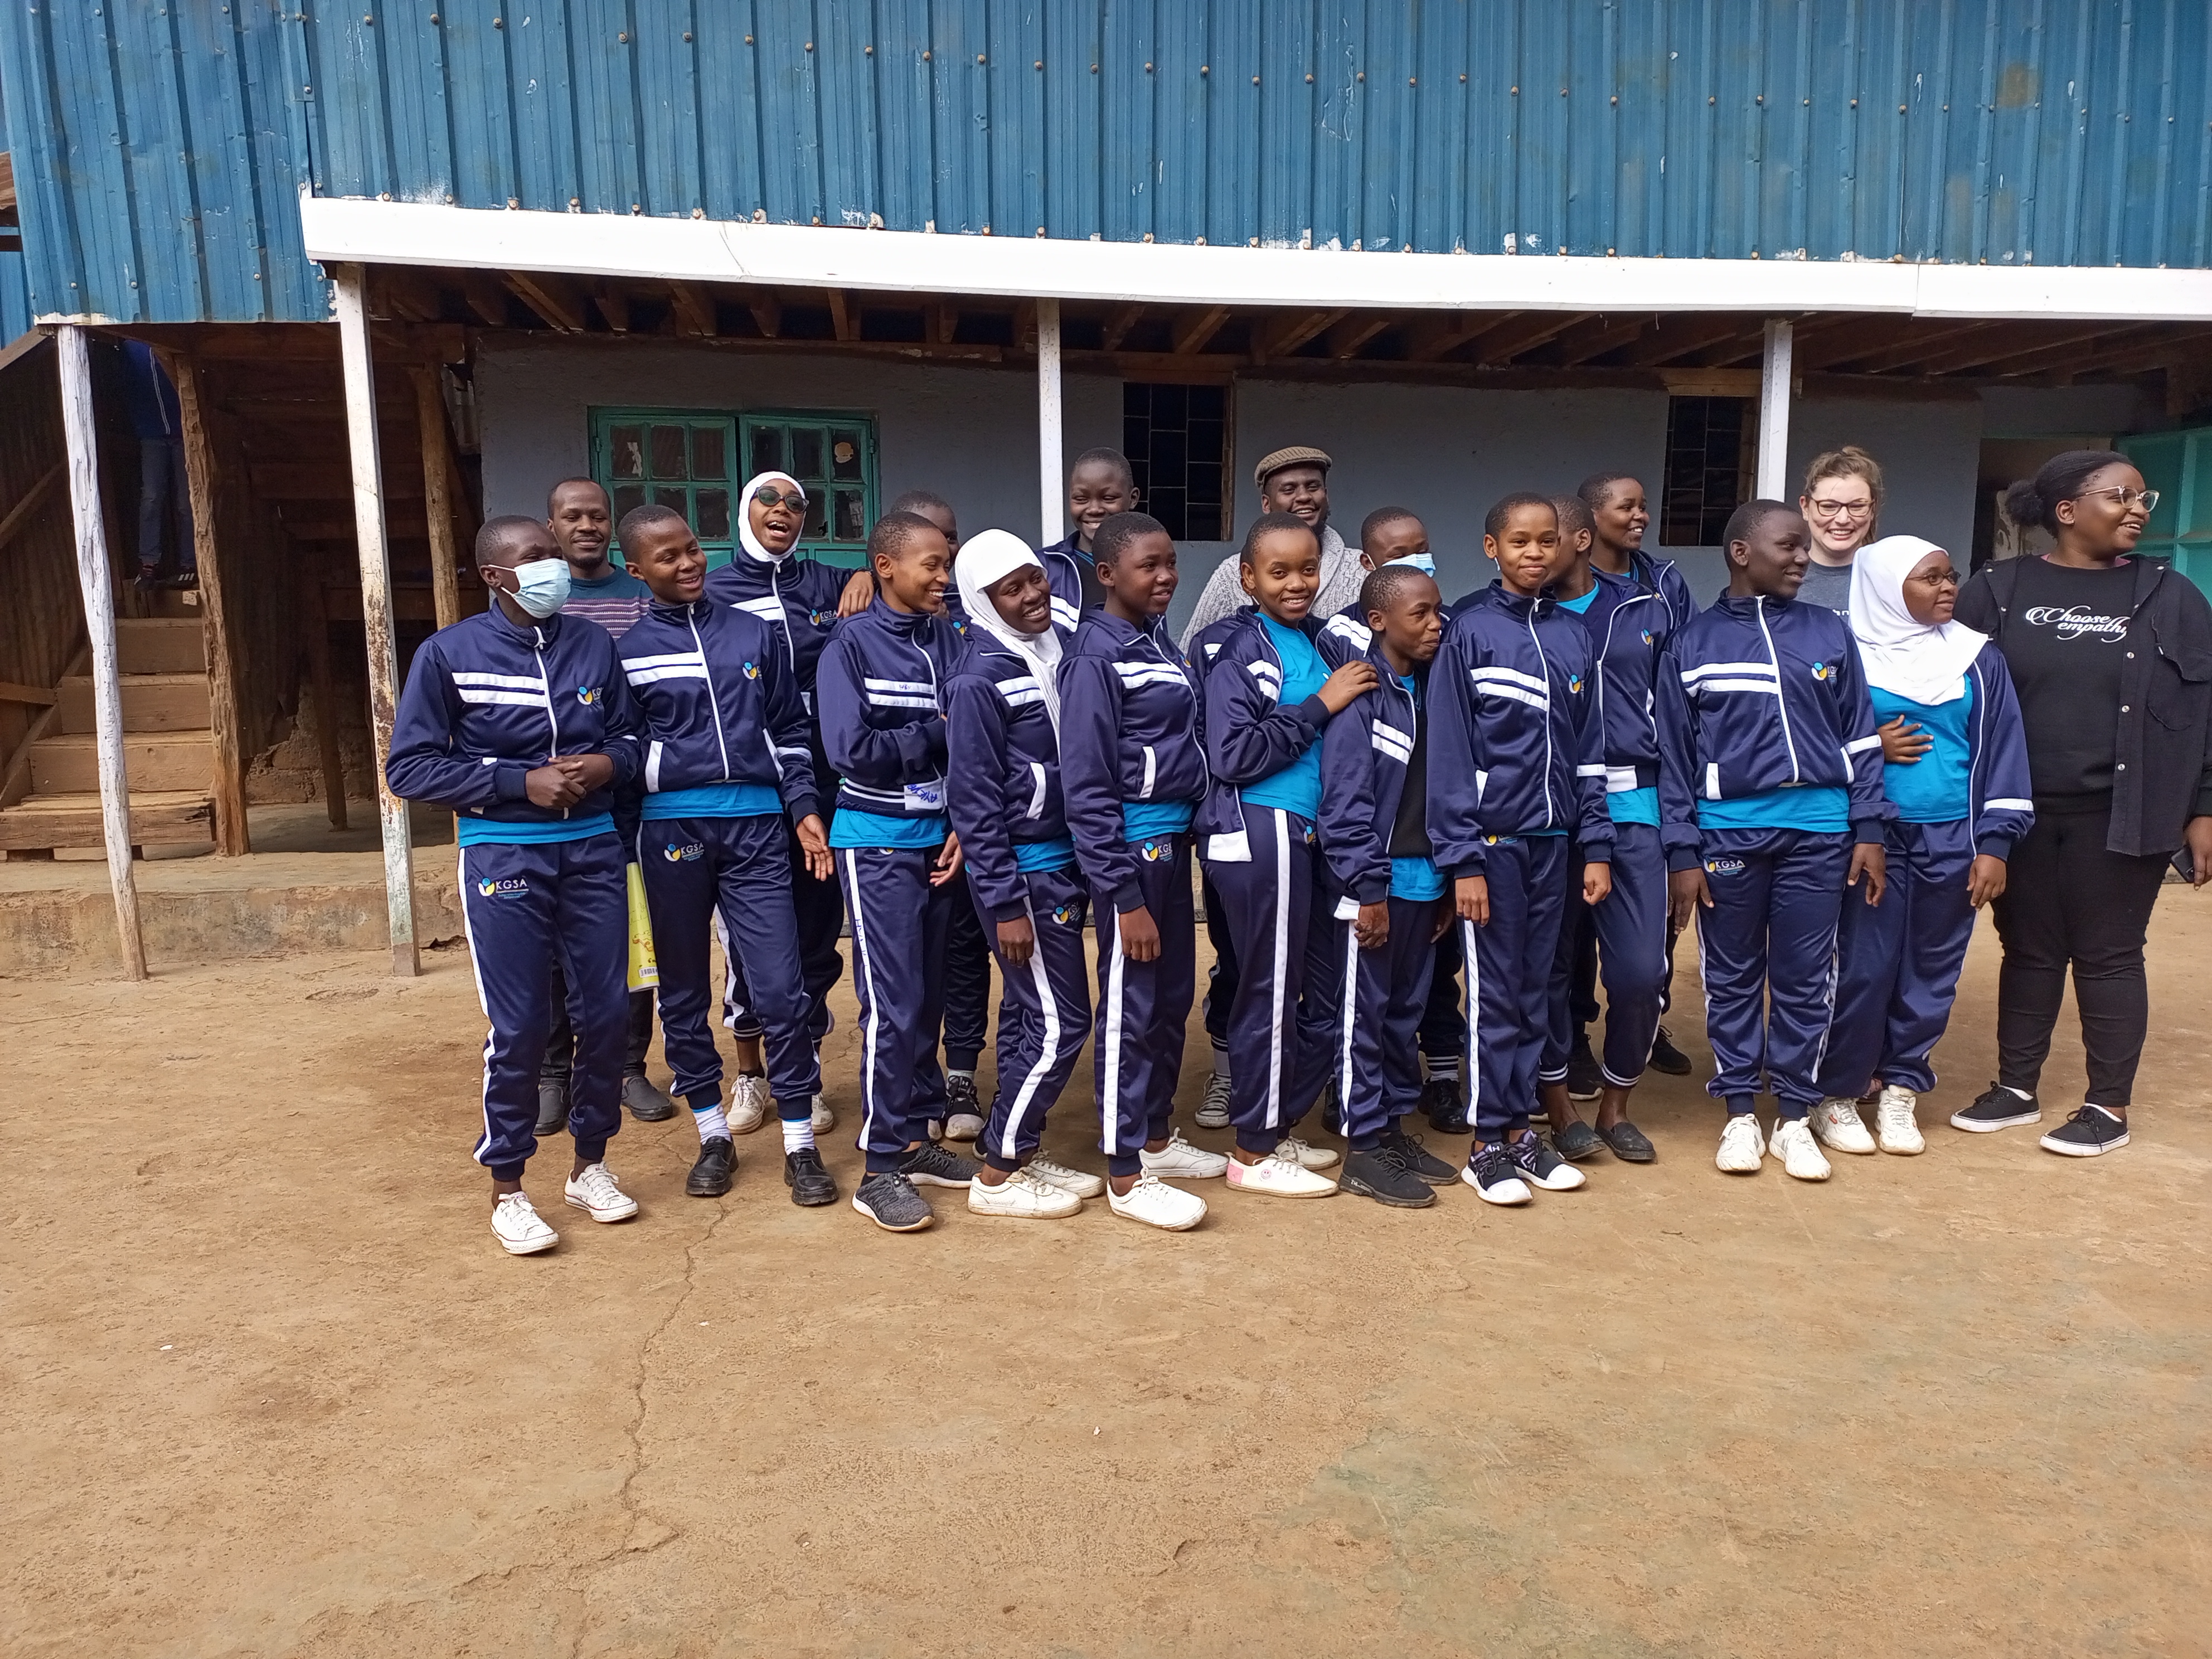 KGSA Students taking a group photo alongside Map Kibera team and YouthMappers’ team representatives
Objectives
The aim of the training program is to achieve the following:
- To ensure inclusivity of marginalized groups i.e. girls (from Kibera) in the technical space of GIS mapping and more. In recent years we have seen lots of women getting involved in open mapping projects, through this training we anticipate having more girls joining the space and also starting them this early. We hope through this that the gender gap that has been experienced in the OSM community will narrow down.
- To equip the students with skills in open mapping specifically on OpenStreetMap
- To introduce high school students to careers in mapping(GIS), Geography, and technology. And whether they take a different path in their country, it’s good to remind them that they can be a doctor or a lawyer and still be an active contributor.
- To increase map coverage by involving more people in open mapping on OSM.
- To explore training different groups i.e. high schools other than universities and organizations on open mapping; so that we can use this as a module to train other similar groups in the country.
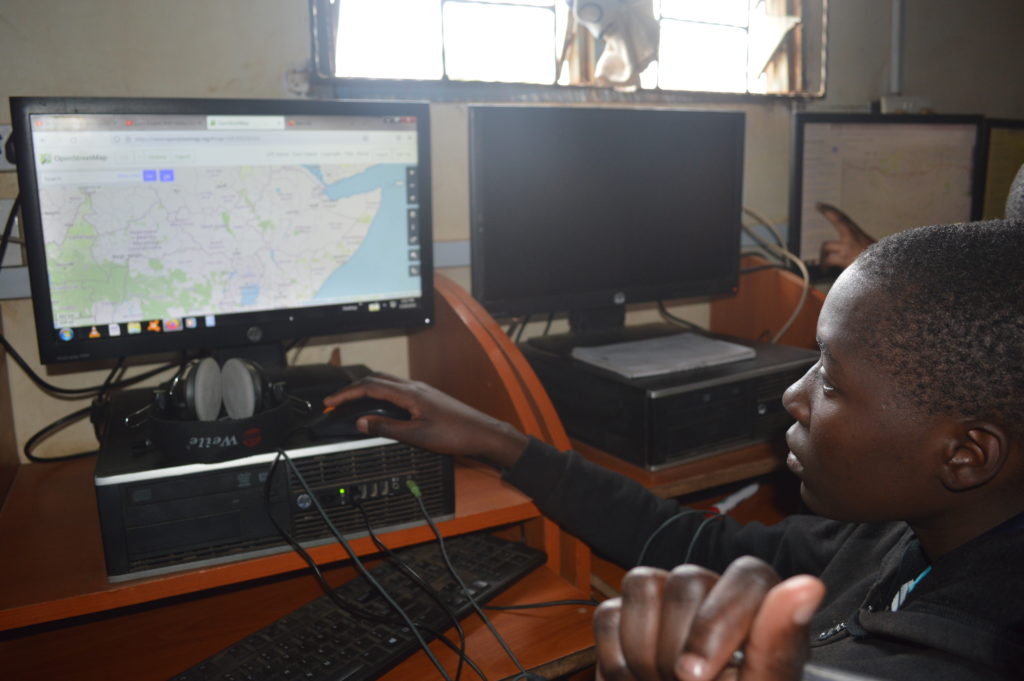
Students getting hands-on editing using iD editor walkthrough
Progress
For this training, we have borrowed the teachOSM module, which is geared at introducing OSM to high schoolers. We have so far covered seven modules out of the twelve in the past three months (May to September).
The training has been open to all students since OpenStreetMap is all-encompassing with regard to the application of open data.
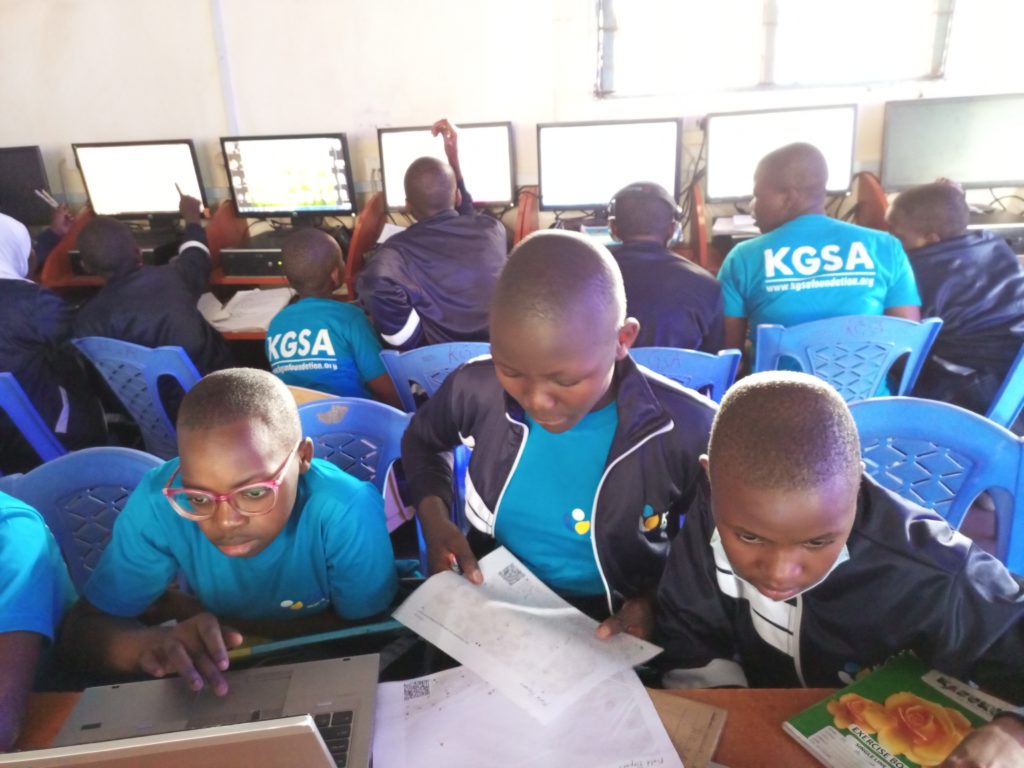
Students use field papers to identify points missing on the map and what needs to be added.
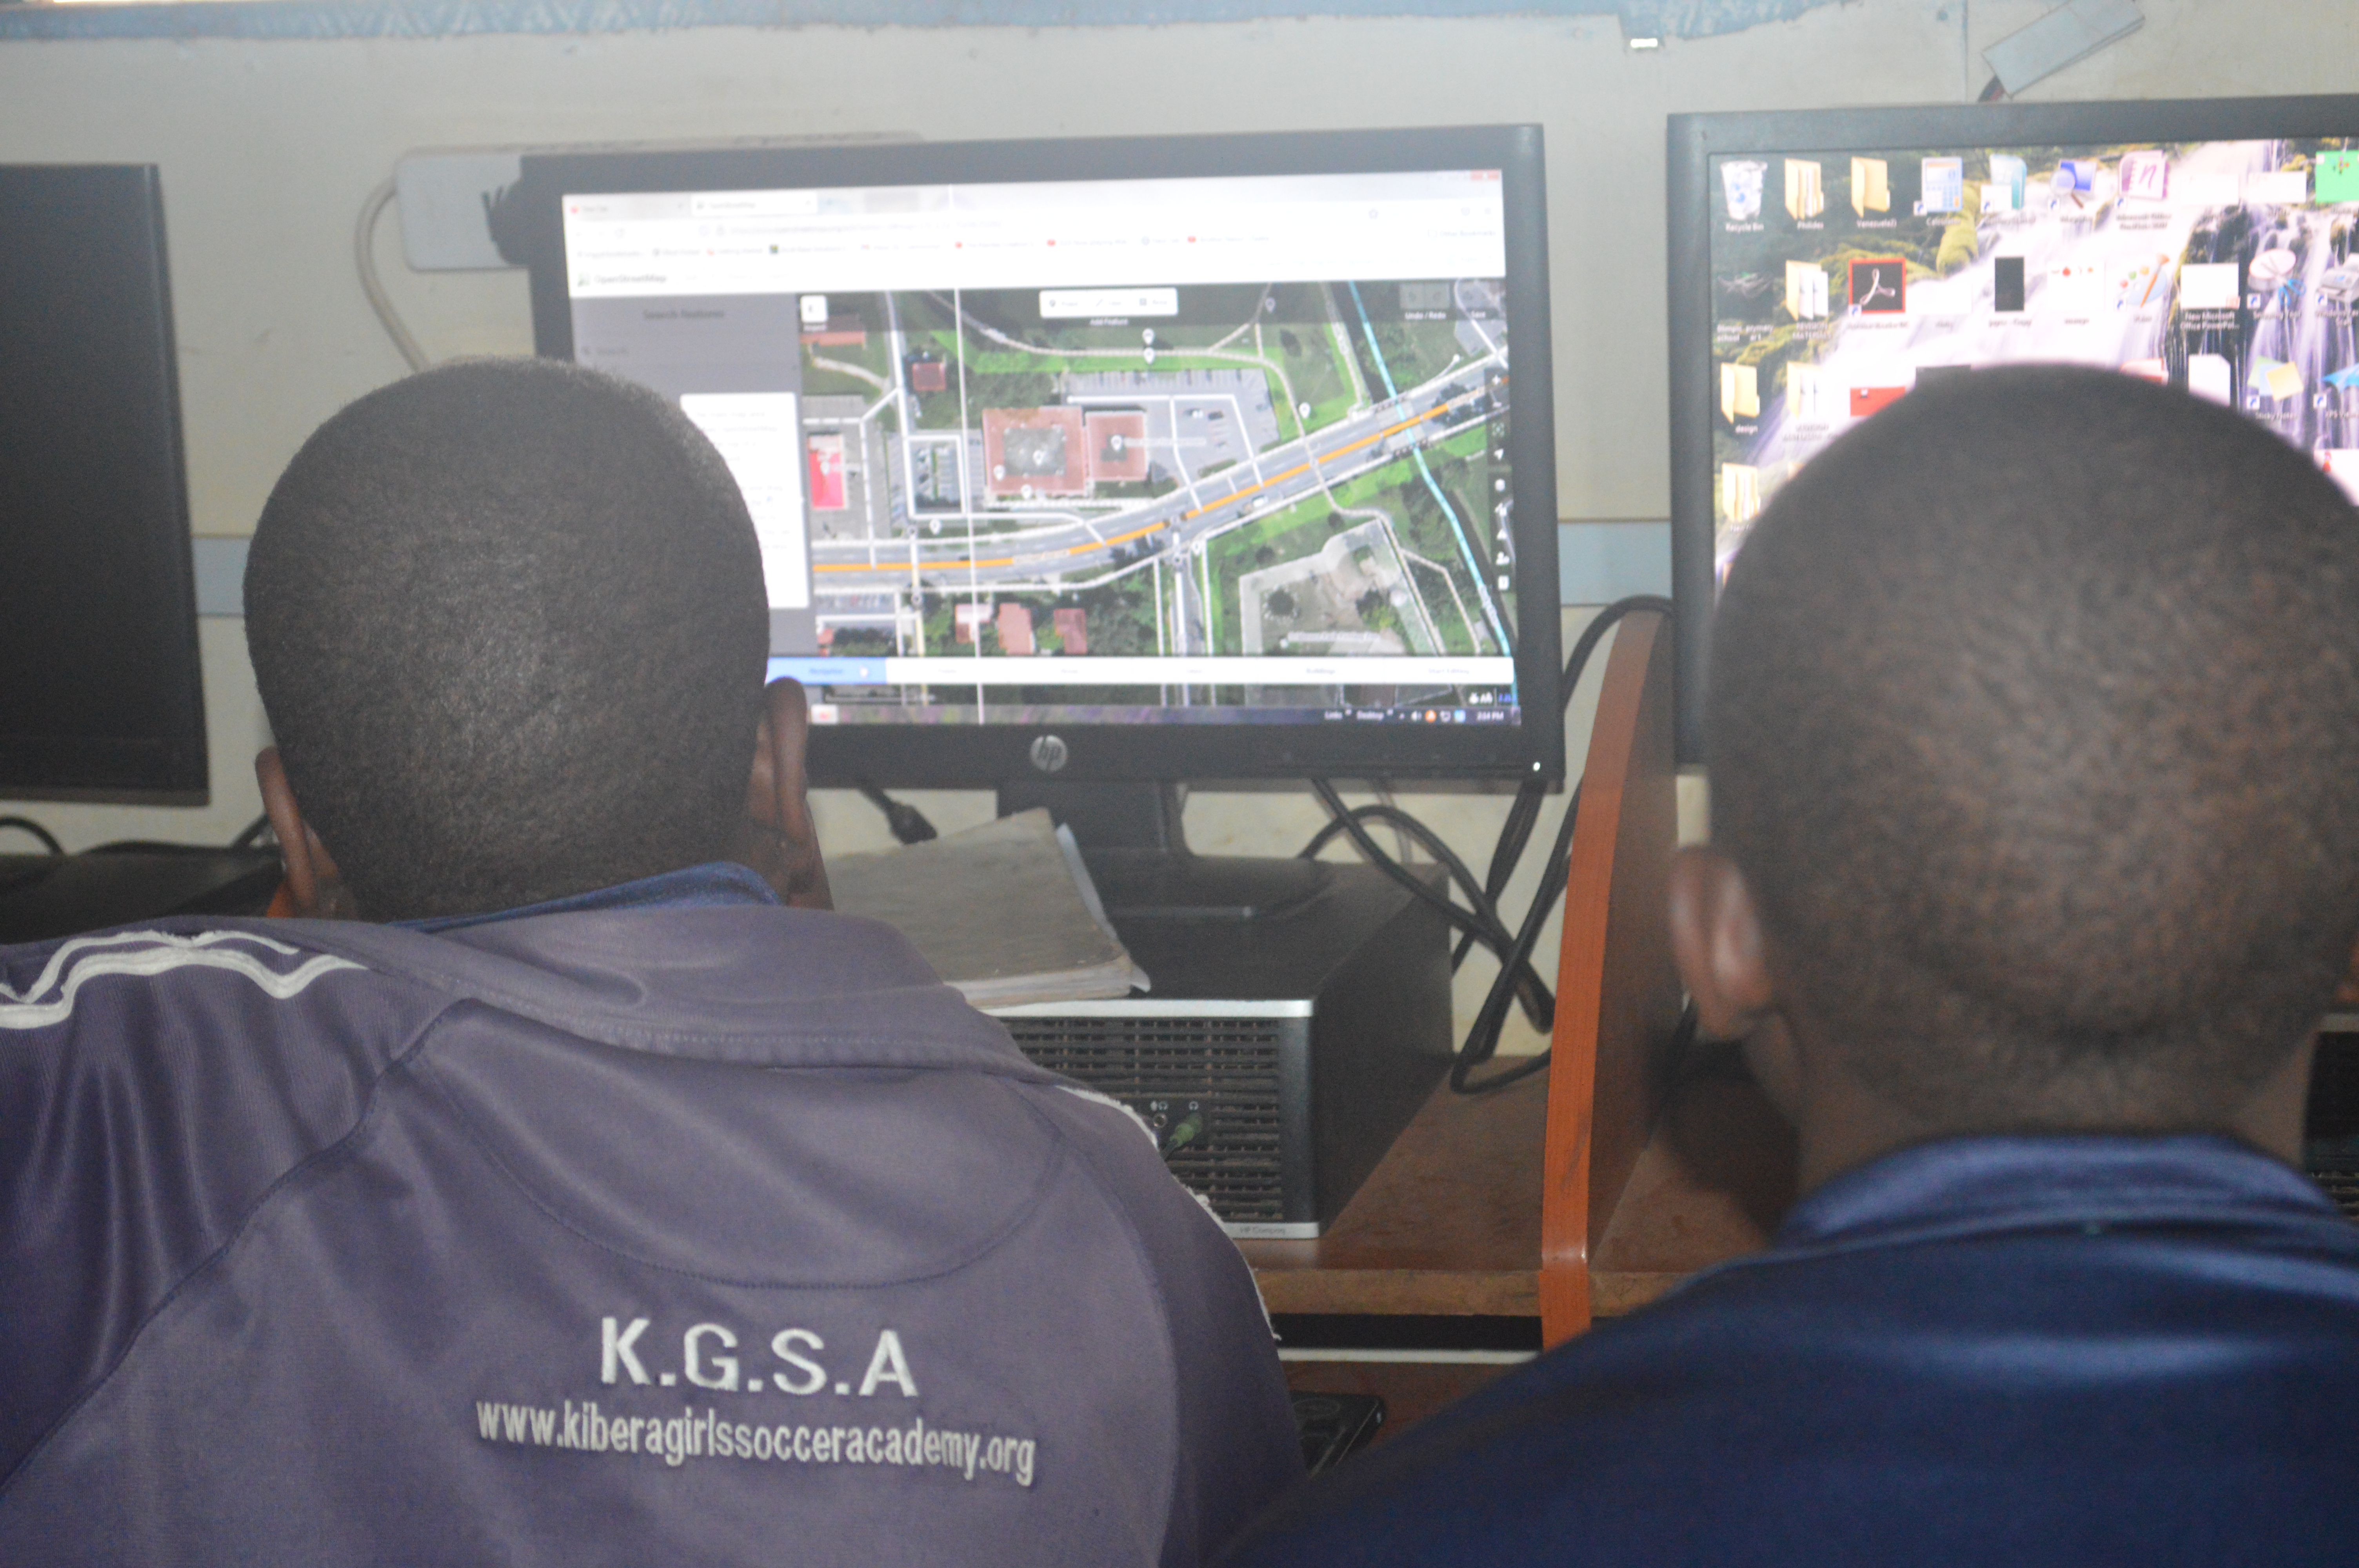
Eye on the data.
Looking forward
- Our earnest desire would be to ensure continuity of the OSM training and probably scale up to other locations of the country.
- We also hope that by the end of the training program, the students will have been equipped with skills that they can build on after their high school diploma.
- The training is also wired to be closely tied to the school curriculum to ensure relevance and harmony with the Kenyan high school education system.
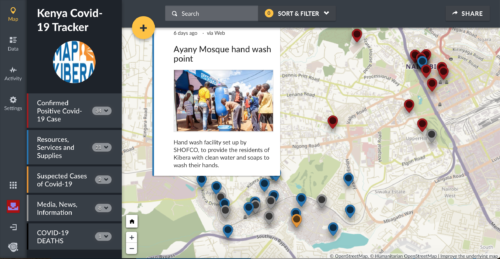
One year ago, the world was overwhelmed by the Coronavirus (COVID-19) pandemic. This prompted a change in the way things are done and organizations were forced to adapt new ways of coping with the global crisis. Map Kibera therefore was honored to execute a project dubbed Kenya Covid-19 Tracker that involved mapping of COVID-19 data in Kenya-with emphasis on informal settlements i.e. Kibera and Mathare.Â
Map Kibera designed an open, detailed yet simple Ushahidi Deployment map (Kenya Covid-19 tracker) that illustrates the extent of the infections of the corona virus per county, with help from individual donors through Global Giving. The site has tracked resources made available by many different organizations and the government to halt the pandemic in the slum areas of Kibera and Mathare, such as hand wash points, mask and soap giveaways, food distribution and more. The Kenya COVID-19 Tracker also shows news that is directly related to the corona virus sourced from blogs, websites and eye-witness accounts among other various sources. Visit (https://kenyacovid19.ushahidi.io/views/map)
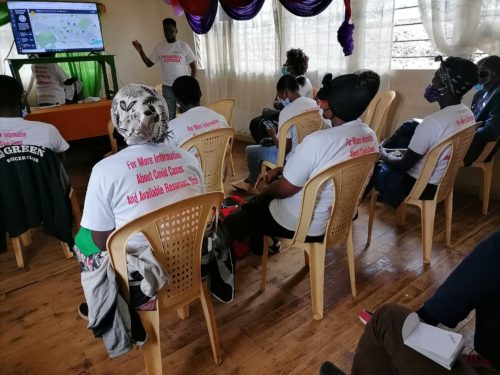
Though the better half of 2020 involved working remotely as opposed to the traditional 9 to 5, map kibera managed to coordinate a great number of events both remotely and physically with strict adherence to the COVID-19 restrictions that were stipulated by the Ministry of Health and the Kenyan Government. Some of these activities include:
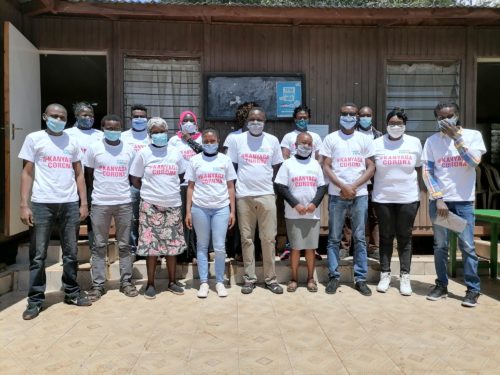
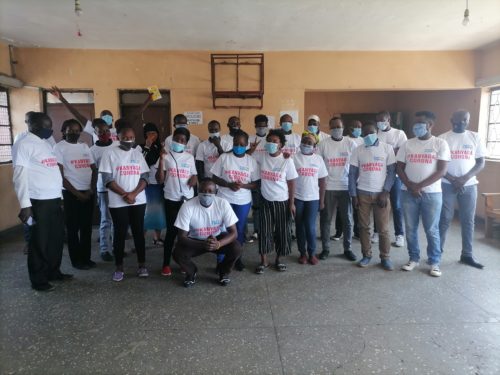
Map Kibera staff together with community volunteers who participated in the project clad in the T-shirts that were distributed to create awareness.
Training of community volunteers.
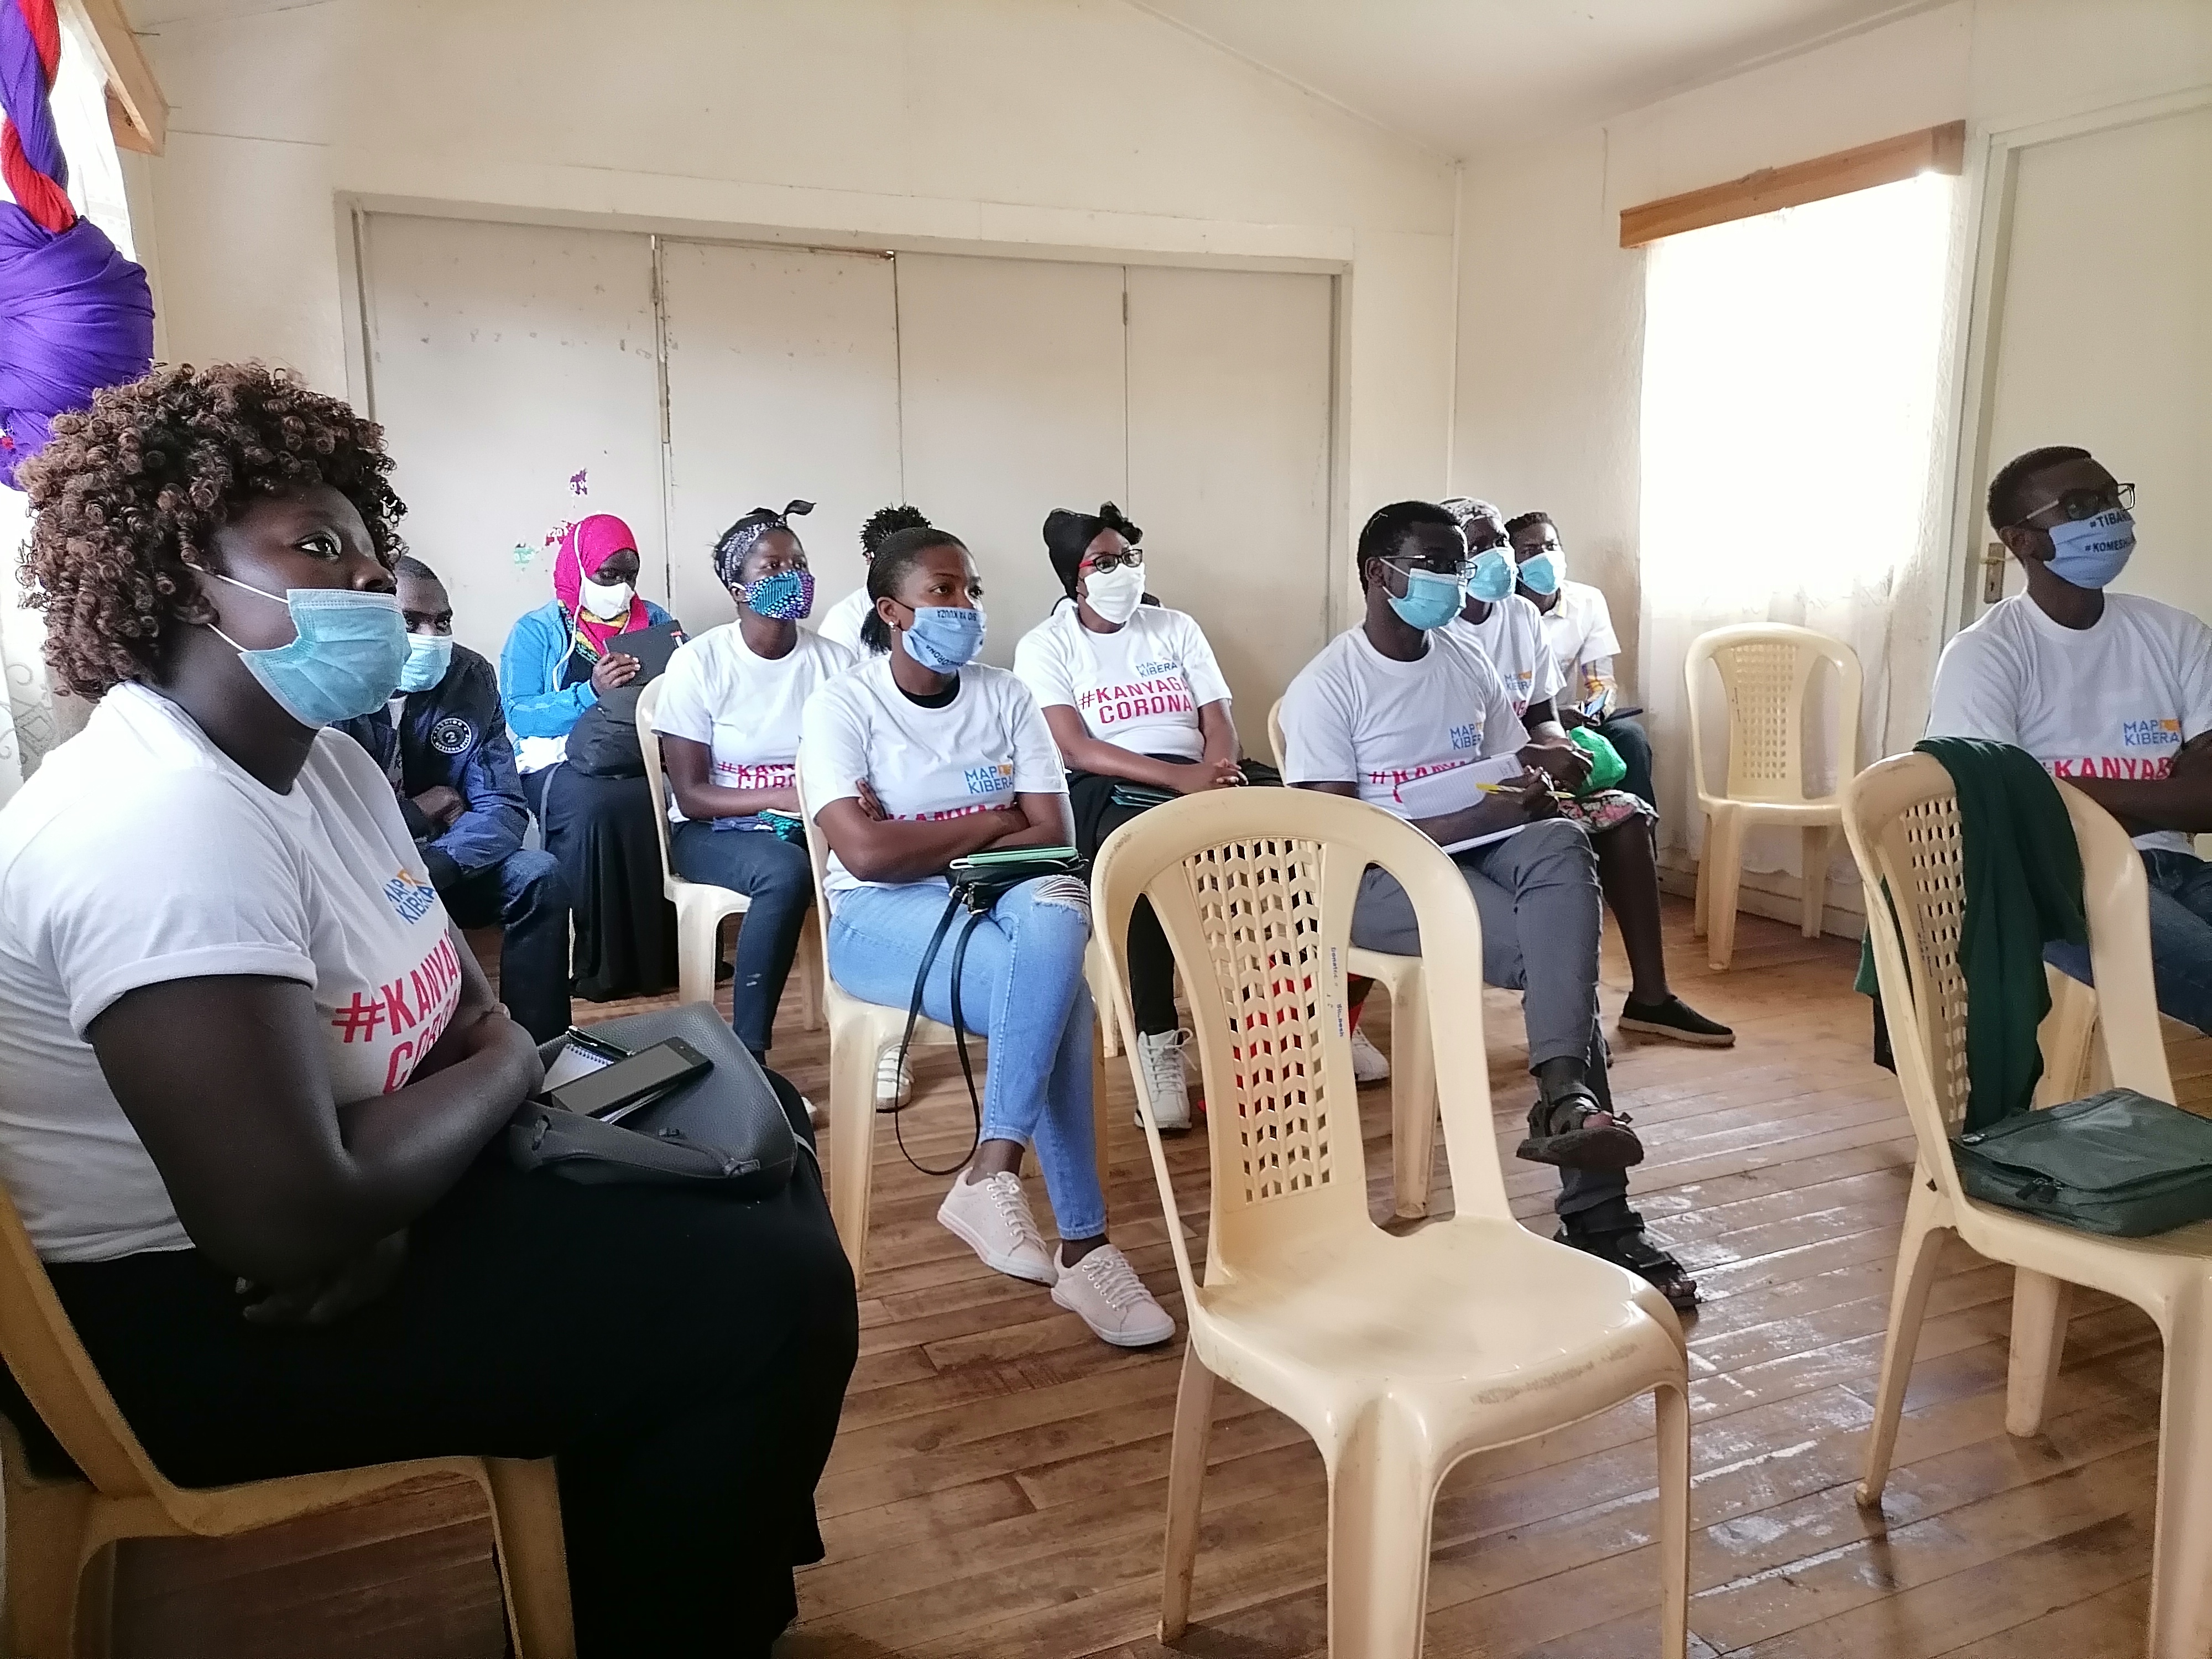
Thanks to a partnership developed with Ushahidi and FCDO-DAP funding, volunteers and enumerators were trained via webinars and physical meetings that were strictly adherent to the COVID-19 protocols. They used mobile phones to capture data on the ground (Ushahidi Mobile Application) and uploaded the same to the Kenya Covid-19 Tracker. There was also desktop based research that was conducted remotely to report also on the-news, cases of infection, death and recoveries. Additionally, Map Kibera staff were tasked with quality assurance, this ensured that data added on the Kenya Covid-19 Tracker were accurate and timely and as truthful as possible to avoid cases of misinformation and rumor mongering.
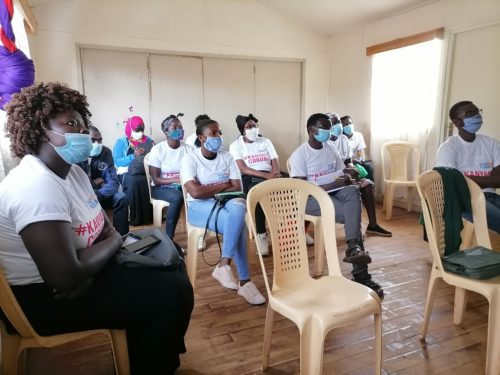
Community volunteers from Kibera during one of the training sessions at Mchanganyiko in Kibera.
Field mapping and reporting
Since mapping and data collection is labour intensive, Map Kibera had to recruit data enumerators and volunteers from all the villages of both Kibera and Mathare to assist in the mapping of COVID-19 resources and also report on the news. This involved mapping out of hand washing stations that were donated by various organizations, food distribution conducted by various charitable organizations and also in general; the distribution of various items that ranged from face masks, hand sanitizers and Personal Protective Equipment (PPEs) that were donated to various health facilities to assist in the fight against the spread of COVID-19.
https://kenyacovid19.ushahidi.io/views/map
Updates and Follow up
Furthermore, there was also need to make regular updates due to the emerging issues in the wake of the coronavirus pandemic. Towards the end of the year 2020, certain trends were emerging that needed to be captured in the story map. For instance food donations were gradually decreasing as the government initiated economic recovery plans and this move so many people resume work. Consequently as the situation normalized, people also started neglecting some of the protocols and this resulted in the neglect of hand washing stations-which were in most cases taken by individuals for domestic use.
Map Kibera’s Zack Wambua conducting a training session on the Kenya covid-19 tracker project.
 Mural on the Wall
Map Kibera went a step further to draw murals on public spaces in both Kibera and Mathare. The purpose of the murals was to create public awareness and also create an offline platform for the public to interact with the data on the Ushahidi Deployment map (kenya covid-19 tracker). This has proved to be a useful approach because it ensures transparency and data sharing to the benefit of the community at hand-in this case Mathare & Kibera.
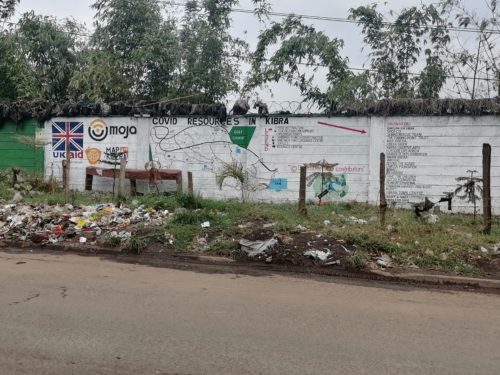
Kibera Resources mural along Kibera Drive.
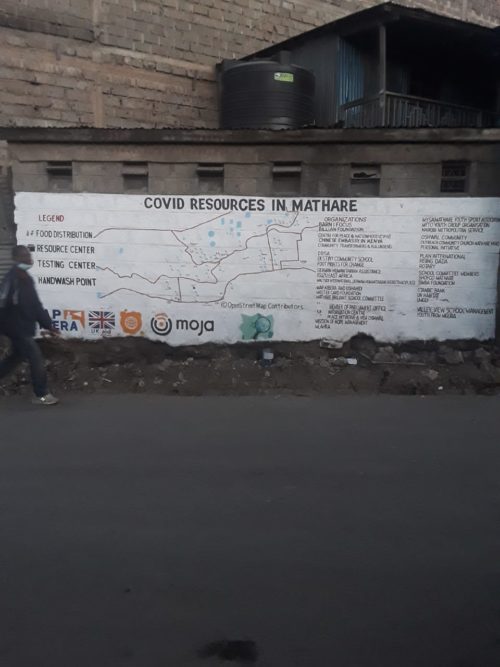
A mural in Mathare showing the Covid-19 Resources
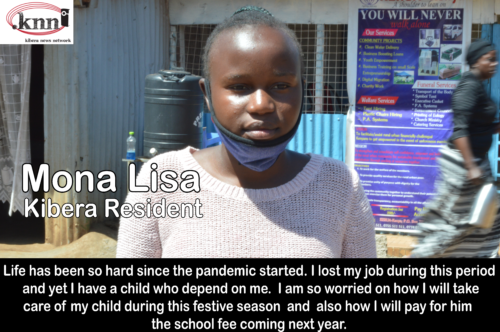
Humans of Kibera & Mathare
Kibera News Network (KNN) also started an initiative called Humans of Kibera and Mathare. In this case random people from both locations were interviewed and they shared their ordeal during the Coronavirus pandemic and how they made it through the tough season that was characterized by lockdowns and curfews.
Internet provision from Moja WiFi
Map Kibera also partnered with Moja WiFi to provide internet services at specific public points in both Kibera and Mathare slums. Since most of the work had to be online. Furthermore Moja wifi showed some of the video clips from KNN on their online platform in a bid to further share with the public regarding covid-19 experiences and eye witness stories.
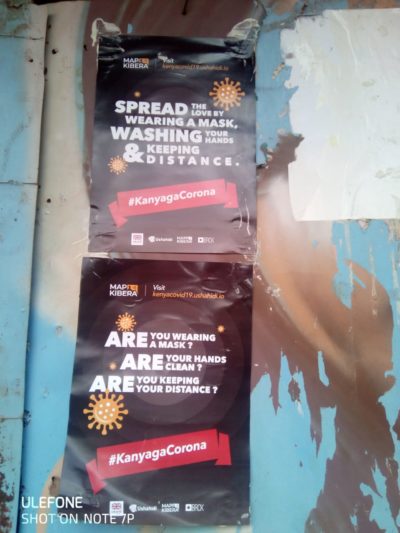
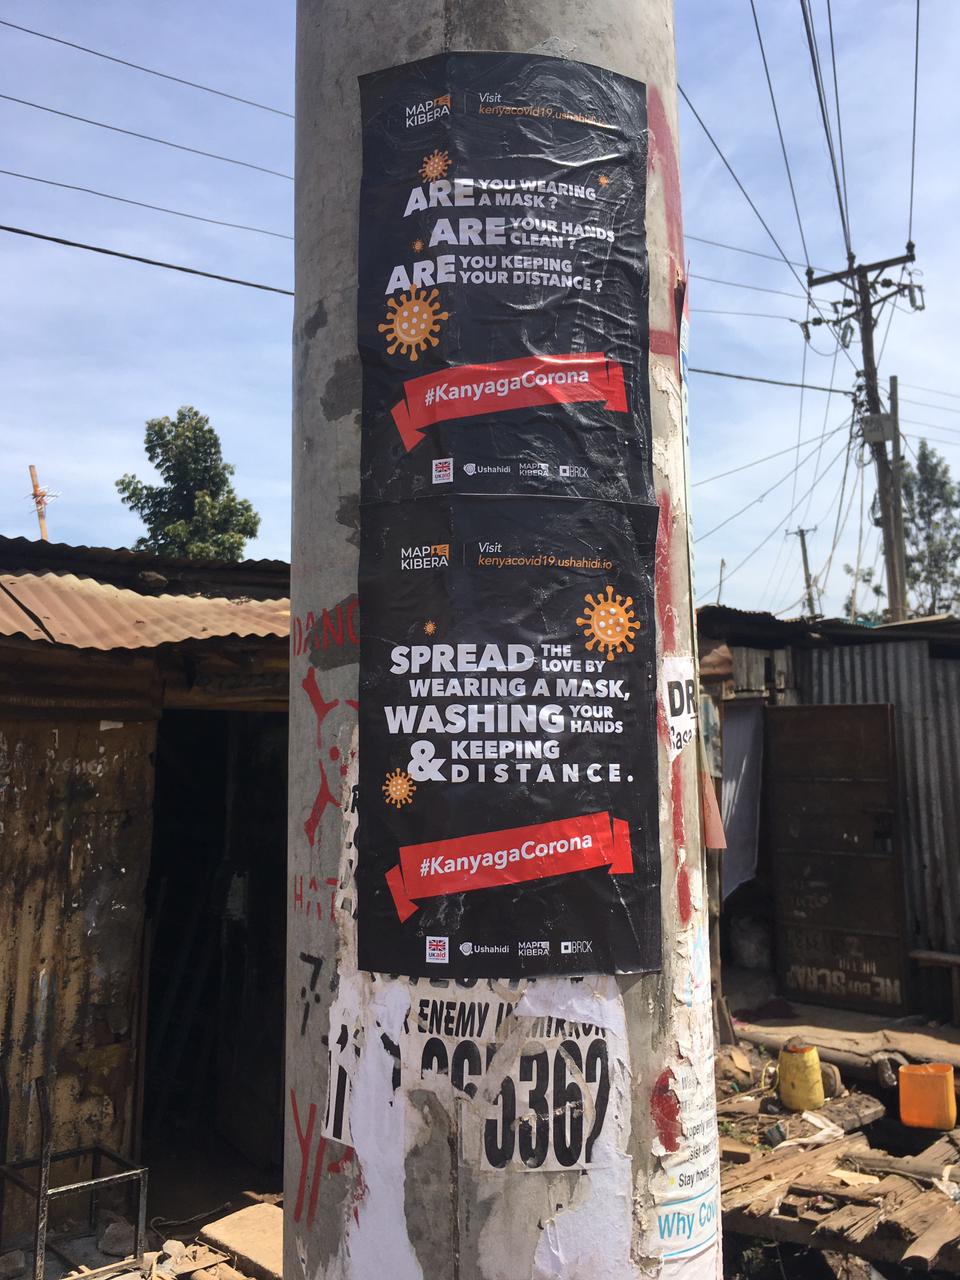
Posters were also circulated to the residents of Kibera and Mathare to create awareness.
 The team from Mathare were equally excited for being involved in the project.
ImpactÂ
The Kenya COVID-19 Tracker had a great impact on the residents of Kibera and Mathare as well. People had the chance to interact with the data through the wall murals and the online platform. “…We know that information is power and the ability to access it is even more powerful…†as stated by Moses Omondi, a resident of Kibera and also team leader for Adopt a family, an NGO that has used the data provided by the Kenya COVID-19 Tracker deployment map. He further acknowledged that the map offered direction in terms of where to source for different services, how to also access different resources like food distribution and donations with regards to the COVID-19 challenges in Kibera. The deployment map was created in a way that it can be used for various purposes like for health reasons, logistical and also general information.Â
In conclusion, the Kenya Covid-19 Tracker Project was a success and the extensive data that was generated is actually free to all interested parties and can prove resourceful with regards to how informal settlements are equipped in times of distress; for this case a disease outbreak. This open data can be used to address an occurrence of the same nature and magnitude and with the insights provided, the necessary measures can be applied to achieve the best results in governance and service provision.

We are proud to announce that Map Kibera’s team, led by coordinator Joshua Ogure, have been chosen as one of The 100: Tech Community Appreciation Award winners by iHub Nairobi! A special mention was made of the team’s work on Open Schools Kenya. The award was announced during the iHub’s #5YearTechBash party this month held to celebrate its five year birthday. All we can say is the feeling’s mutual – the iHub has been a fantastic supportive environment for the whole Map Kibera team over the years! We appreciate it and look forward to the next five!